Using Crime Data to Drive and Defend Security Resource Allocations
![]() An article by CAP Index’s CEO, Steven K. Aurand, as featured in Security Magazine on May 1, 2012
An article by CAP Index’s CEO, Steven K. Aurand, as featured in Security Magazine on May 1, 2012
The most enduring theory of W. Edwards Deming – one of the business world’s most respected authorities on organizational theory – was that unless an activity is measured, it cannot be properly managed. Dr. Deming believed that all decision-making must be driven by reliable data, and this once-revolutionary concept is now accepted as a fundamental management practice at most corporations around the globe.
For corporate security professionals seeking to measure and manage the available tools and processes designed to protect their organization’s people and property, taking a data-driven approach to decision-making has never been an easy task; particularly for those responsible for the physical security of multiple locations, where reliable information is not always available or consistent; where assets, conditions, and countermeasures may differ; and where a relevant baseline for measurement can be difficult to establish.
Despite these very real challenges, corporations increasingly require security professionals to apply Deming’s quantitative approach to justify their recommendations regarding the selection of security procedures and equipment. Anecdotal reports, past experience, and personal insights have been replaced by objective comparisons, cost/benefit analyses, and industry best practices as the basis for all resource allocations, performance evaluations and management of liability exposure.
Regardless of an organization’s real or perceived security risks, and particularly in the current economic environment, if a security professional can’t provide senior management with well-reasoned and clearly articulated justifications for necessary resources that are based on empirical data, there may be at least one of two unpleasant outcomes:
• Requested security budgets are denied or reduced, and/or
• Senior management begins looking for someone who understands Deming’s theory
For both reasons, an increasing number of security professionals at companies of all sizes have adapted to a new business world that’s driven by quantitative analysis, by learning how to leverage blended crime forecasting data to create, justify and anticipate returns on investments in equipment and human resources, and also to manage premises liability risk, in a manner that puts a smile on the face of their company’s CFO.
How Crime Forecasting Data Can Be Leveraged
Not all elements of a corporate security program are easily measured. However, crime statistics and other demographic information for a specific location and its surrounding geographic area should play an important role in security deployment decision-making. In selecting external crime data on which to rationalize those decisions, it’s important to understand the difference between standard police reports and blended crime forecasting data.
In general, while law enforcement intelligence alone can provide helpful insight into a location’s crime risk potential, those reports tend to vary in consistency from jurisdiction to jurisdiction and are retrospective, looking back at what crime has occurred in the past. Blended external data combines police reports with a range of other demographic information in order to gauge a location’s level of social disorganization, and provides a more robust projection of crime that is likely to occur in the future.
The usefulness of blended crime data for security professionals is two-fold: it provides a more reliable evaluation of a location’s crime risk, and in turn, that consistency facilitates a scoring system that measures relative levels of risk at various locations. This external benchmarking – when combined with a company’s location-specific internal data such as claims/incidents history, shrink, and other loss variables – enables companies to develop, rationalize, establish and defend security threshold levels and their corresponding resource allocations.
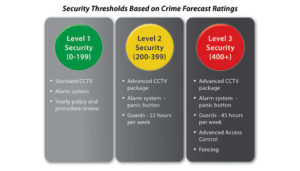
As figure 1 suggests, crime forecast ratings can serve as the basis for classifying the risk profiles of various locations, which in turn, facilitates a consistent approach to the assignment of physical resources.
Nationwide Insurance Applies Data-Based Benchmark
The practical benefits of applying a data-based weighted benchmark for security resource allocation is apparent for many large companies, including Columbus, Ohio-based Nationwide Insurance, which maintains approximately 400 retail office locations at all times, and opens at least five new offices each year. Jay C. Beighley, who has overseen Nationwide’s security operations since 2001 and previously served as security director for the State of Ohio, was also responsible for security at two well-known retailing firms and has authored two books and several articles in his 20+ years as a security professional.
According to Beighley, blended crime forecast reports enable Nationwide to establish a consistent starting point for measuring relative levels of crime risk at its retail locations, and for assignment of appropriate security resources. This uniformity provides Nationwide with several practical benefits, including:
• The ability to maintain an efficient system for the assignment of physical resources. Risk management formulas can never be 100-percent perfect, but if they are based on reliable data and updated regularly, they offer security professionals the most efficient means of objective, rational, and defensible resource allocation.
• Reduced personnel and travel-related costs. For companies with multiple locations, even those significantly smaller than Nationwide, the expense related to providing boots on the ground to assess risk levels at every new and existing location can be cost-prohibitive.
• A defensible position for premises liability litigation that may arise. The key inquiry in these cases is based on whether a premises owner may be held liable for failing to protect people from the results of reasonably foreseeable criminal conduct. If and when a third-party criminal event occurs, a well-documented multi-tier risk management plan that addresses the issue of foreseeability provides companies with protection against an adverse verdict.
• Purchasing leverage with various security resource vendors, by demonstrating the company’s intentions to maintain specific levels of investment. Vendors that know a company is committed to providing specific and consistent levels of security are often far more likely to offer volume-related incentives or discounts for their products and services.
“Most importantly,” according to Beighley, “the ability to build, explain and monitor a rational system for risk management of Nationwide’s assets builds confidence in our professionalism across the entire organization. For a well-known property & casualty insurance provider like Nationwide, this is an important part of our internal culture as well as our external brand reputation.”
Crime Forecast Data Leveraged by Many Banks
Nationwide Insurance is not alone in how it applies crime risk data as a basis for security resource allocation. Established in 1898, Raleigh, NC-based First Citizens Bank operates more than 430 branches located in 17 states and Washington, D.C. Larry Brown, the bank’s senior vice president of Corporate Security who also serves as chairman of the ABA Bank Security Committee, considers blended crime risk data to be an essential planning tool.
Because of the bank’s historically strong balance sheet, First Citizens has rapidly expanded over the past decade and continues to increase its national footprint. As growth continues, the bank must address all of the related security issues. According to Brown, blended crime data reports are particularly useful for the selection of sites for new bank branches. When a new branch is in the planning stage, First Citizens’ facilities division forwards Brown a list of possible locations within the selected community. Brown then generates a risk assessment report for each potential address, and also receives a county score that compares the site to the average risk of the county, state, and national site risk scores. This information is supplemented with average scores from the past and a forecast of future scores.
Additionally, Brown’s recommendation for site selection is based on demographic information for the surrounding population and a map that visually identifies risks within a three-mile radius. He uses the data to validate or dispute reports he receives from local law enforcement and other credible sources, such as his peers at banks in the area. If there is a significant discrepancy between the data and local opinion, then Brown digs deeper to resolve the differences and get a clearer view of the site’s risk profile before a final decision is made.
One of the cases requiring closer examination involved a potential branch site – located directly across the street from a police station – that reflected a relatively high-risk rating. Further investigation by Brown, however, showed that all crimes in the area had mistakenly been attributed to the police station address, which in turn, incorrectly reflected the potential branch location as an exceptionally crime-prone location. By investigating this apparent anomaly, Brown was able to identify a prime location for a bank branch.
The ability to run comparative reports on existing branches also enables First Citizens to monitor rising and falling risk levels. The comparison reporting function has allowed Brown to better allocate his security budget. “We want to spend our resources wisely and not all locations in a region need to have the same level of security, nor do they always remain the same,” he notes. Our data-based approach better equips us to decide which branches might need enhanced security, such as security vestibules or bullet-resistant glass.
This is also the case at Green Bay, Wisconsin-based Associated Bank, which operates nearly 270 offices in Wisconsin, Illinois, and Minnesota. According to Mark Heffernan, vice president of Physical Security at Associated Bank, crime forecast information plays an essential role in resource allocation and is directly related to the safety of employees and customers.
Associated Bank established a risk-based rating system at all of its locations a few years ago. Heffernan notes, “This system is a combination of six separate measurements, including the type of location, amount of cash on hand and blended crime risk data for the area. We view the data-based score as a true independent indicator of the risk environment in which a particular branch is operating.”
Associated Bank’s rating system categorizes all of its branches as high, medium, or low risk. Based on that rating system, the bank establishes security standards for each branch involving, for example, CCTV/DVD systems, remote monitoring, security guards, RFID, EAS, and physical design considerations. Branches with higher risk ratings typically receive a greater level of security equipment than branches with relatively lower risk assignments.
Risk Rating Systems Must Have Flexibility
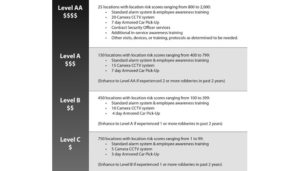
The diversity of locations in which banks like First Citizens and Associated Bank operate illustrates the importance of building flexibility into the creation of any security resource allocation strategy that’s anchored with consistent crime risk data. While external risk information provides an objective basis for a retail operation’s risk classifications and initial resource allocations, decision making must be flexible and factor in recent internal, location-specific crime experience.
As the theoretical chart below suggests, specific locations that have been classified using a well-defined risk categorization strategy can be re-allocated as a result of recent crime activity. For example, a bank location rated as a “Level C” risk based on blended crime data, might be re-assigned to a “Level B” risk if a robbery has occurred at that location within the past two years.
Converting Crime Data into Tangible Outcomes
The cost implications and planning advantages of a flexible, tiered risk management system are readily apparent, easily understood, and well appreciated by a company’s senior managers. Notably, using statistical analyses of its own internal data combined with blended external information, a company with multiple locations can optimize security resource allocation and achieve potential savings on countermeasure expenditures.
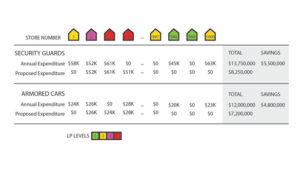
As depicted in Figure 2, a large retail operation with 1,000 stores currently spends $13.75 million annually by employing security guards on a consistent basis at all of its locations. By using crime forecast data to categorize 4 distinct levels of risk, and by using statistical analyses to determine the optimal allocation of security guards at each location, this company has the potential to reduce its overall security guard expenditure by $5.5 million annually.
Using the same 1,000 location example, the company additionally has the potential to reduce its overall expenditure for armored car service by $4.8 million annually. This same principle applies for companies of all sizes, with their potential for savings based largely on the number of locations they operate, and the types of security countermeasures they employ.
Increasingly, security professionals are becoming more adept and comfortable using objective crime data to identify future trends, to analyze the impact of decisions or events, and to evaluate the performance and economic justification of tools and resources.
Correspondingly, as the level of analytical sophistication and application of data-driven decision making increases across companies of all sizes and industries, these loss prevention and security resource allocation methodologies will no longer be considered cutting edge solutions; they will eventually be viewed as standard practices for prudent risk management.
Corporate security professionals who understand, introduce, and successfully manage data-driven disciplines are currently in a position to provide significant, tangible benefits to their companies and to their own careers. Those who drag their feet should be prepared to explain what they’ve been waiting for.
Latest Posts
 Sample CRIMECAST Reports

Terms Of Use | Privacy Policy | Accessibility
© 2020-2024 CAP Index, Inc. All Rights Reserved.
Site Designed by R2 Creative Group