COVID-19 & Crime Issue #4: Crime Trends for Select US Cities
The Analytics team at CAP Index continues to monitor how COVID-19 is impacting crime trends across the country. In this issue, we take a look at weekly crime trends in four major cities across the United States, starting with the first week in March (Week #1 below).
It should be noted that COVID-19 restrictions started being implemented between Week #2 and Week #3. We just completed Week #9 and we will continue to track crime trends into the future as police data become available. The cities shown here include the three largest metropolitan areas in the United States, each with significant COVID-19 issues, along with Seattle, which was one of the earliest COVID-19 hot spots.
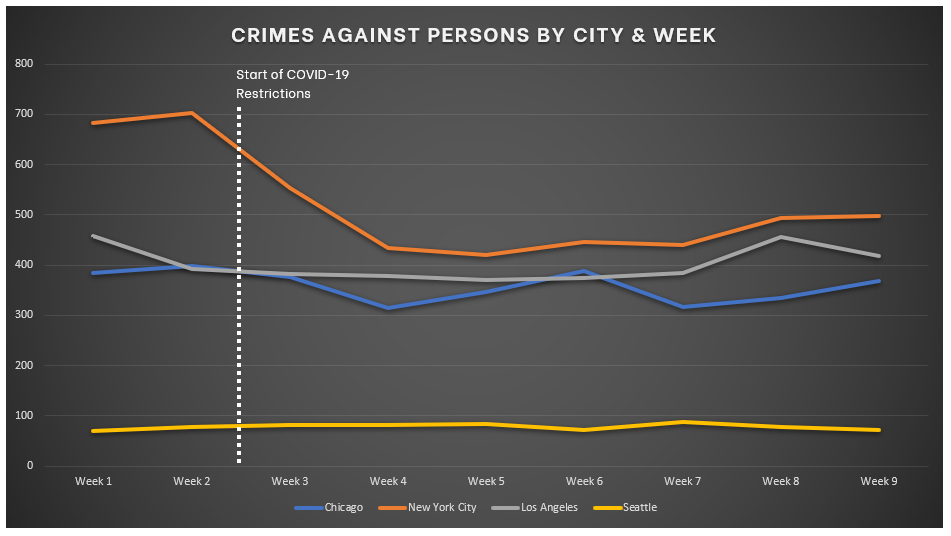
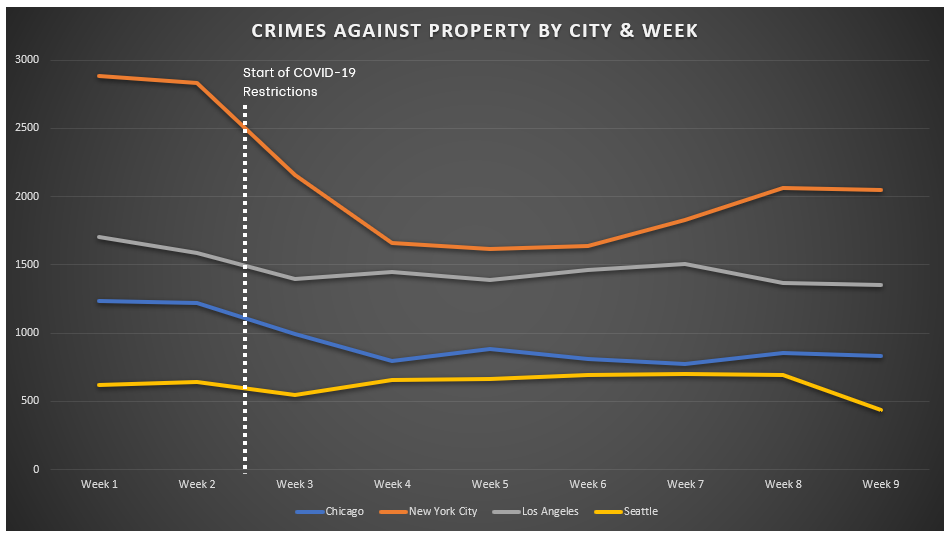
In the charts below, most cities show a drop off in crime starting with Week #3. The magnitude of this decrease varies from city to city. The data suggest that crime might be trending upward in recent weeks, but we will need to continue tracking this information to see whether this is a persistent trend.
The bottom tables provide monthly crime count comparisons for the same time periods in 2019 versus 2020. They tend to show crime increases of differing degrees for the first two months of the year followed by significant decreases for March and April. Again, please note that COVID-19 restrictions began to be implemented in the middle of March.
TRENDS FOR CRIMES AGAINST PERSONS
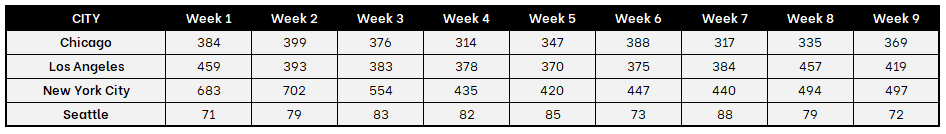
The following table and chart show the trends for Crimes Against Persons, which include Homicide, Rape, Robbery, and Aggravated Assault. Note that week #1 begins on March 1st for all cities except for New York City, which started on March 2nd.
Crimes Against Persons – Weekly Data
Crimes Against Persons – Monthly Data 2019 vs. 2020

TRENDS FOR CRIMES AGAINST PROPERTY
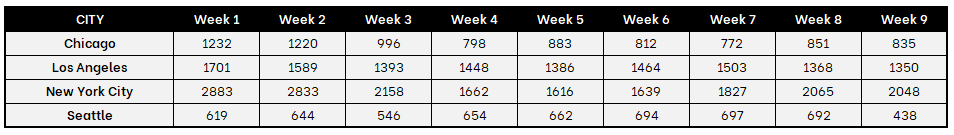
The following table and chart present the number of Crimes Against Property, which include Burglary, Larceny, Motor Vehicle Theft, and Arson. Week #1 begins on March 1st for all cities except for New York City which started on March 2nd.
Crimes Against Property – Weekly Data
Crimes Against Property – Monthly Data 2019 vs. 2020

It is critical to make sure you have the best data to assess crime risk during this period and CAP Index is here to help.
Contact CAP Index to discuss how we can help your organization dive deeper into these numbers and analyze crime trends for specific categories.
Sources:
https://data.cityofchicago.org/Public-Safety/Crimes-2001-to-present/ijzp-q8t2/data
https://data.lacity.org/A-Safe-City/Crime-Data-from-2020-to-Present/2nrs-mtv8/data
https://compstat.nypdonline.org/2e5c3f4b-85c1-4635-83c6-22b27fe7c75c/view/89
https://data.seattle.gov/Public-Safety/SPD-Crime-Data-2008-Present/tazs-3rd5/data
Latest Posts
 Sample CRIMECAST Reports

Terms Of Use | Privacy Policy | Accessibility
© 2020-2024 CAP Index, Inc. All Rights Reserved.
Site Designed by R2 Creative Group