COVID-19 & Crime Issue #5: Crime Trends for Atlanta, Austin, Philadelphia, and San Francisco
The Analytics team at CAP Index continues to monitor how COVID-19 is impacting crime trends across the country. In this issue, we take a look at crime trends in four additional cities across the United States on a week-to-week basis and monthly with comparison to 2019 numbers.
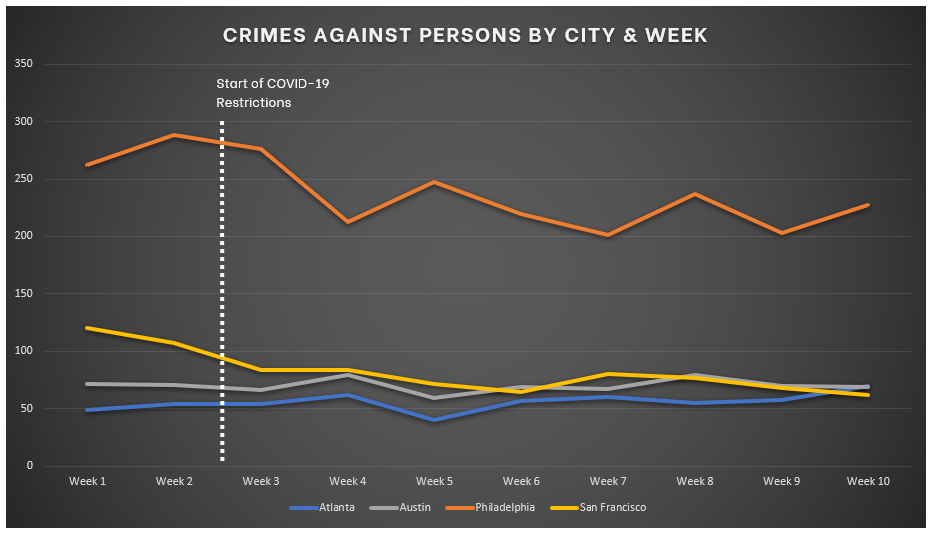
It should be noted that COVID-19 restrictions started being implemented between Week #2 and Week #3. We just completed Week #10 and we will continue to track crime trends into the future as businesses begin to reopen and we have access to more police data.
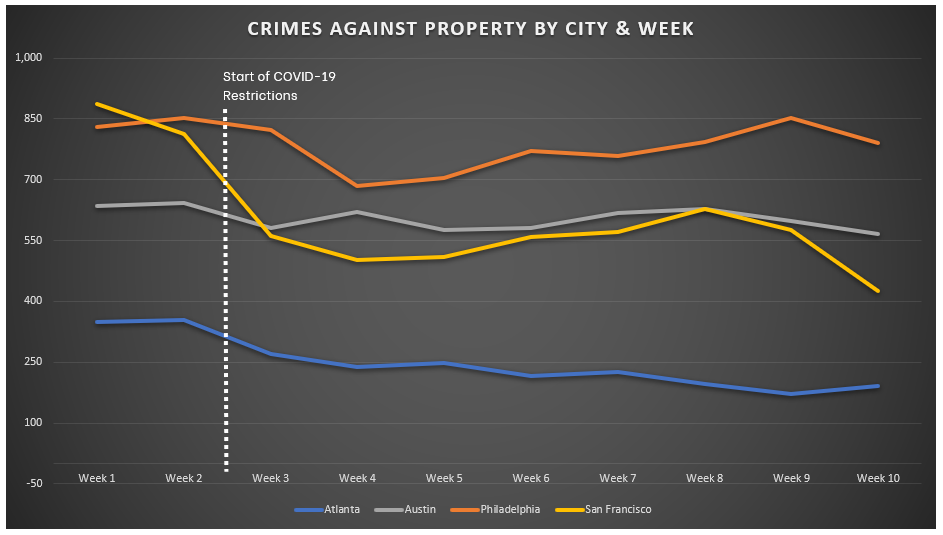
Philadelphia and San Francisco show the impact of COVID-19 restrictions with a drop off in crime starting in Week #3. Austin and Atlanta crime counts are relatively stable across the ten weeks.
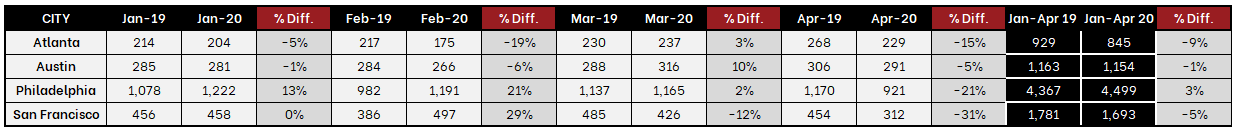
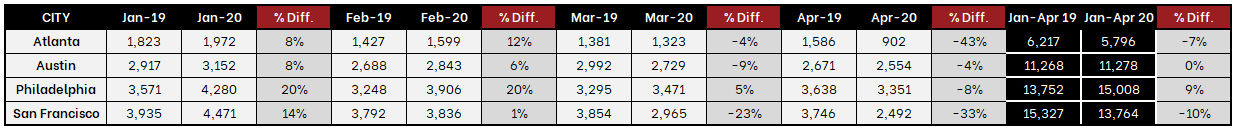
The monthly tables for Crimes Against Persons and Crimes Against Property provide crime count comparisons for 2019 versus 2020. Philadelphia and San Francisco show some crime increases of differing degrees for the first two months of the year followed by significant decreases for March and April. Atlanta and Austin show modest downward or flat trends. Again, please note that COVID-19 restrictions began to be implemented in the middle of March.
TRENDS FOR CRIMES AGAINST PERSONS
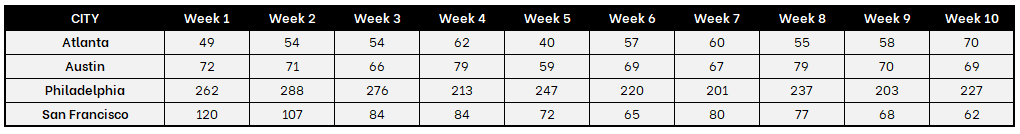
The following table and chart show the trends for Crimes Against Persons, which include Homicide, Rape, Robbery, and Aggravated Assault. Note that week #1 begins on March 1st.
Crimes Against Persons – Weekly Data
Crimes Against Persons – Monthly Data 2019 vs. 2020
TRENDS FOR CRIMES AGAINST PROPERTY
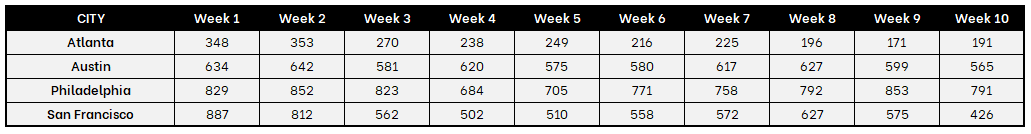
The following table and chart present the number of Crimes Against Property, which include Burglary, Larceny, Motor Vehicle Theft, and Arson. Week #1 begins on March 1st for all cities.
Crimes Against Property – Weekly Data
Crimes Against Property – Monthly Data 2019 vs. 2020
It is critical to make sure you have the best data to assess crime risk during this period and CAP Index is here to help.
Contact CAP Index to discuss how we can help your organization dive deeper into these numbers and analyze crime trends for specific categories.
Sources:
Atlanta – https://www.atlantapd.org/i-want-to/crime-data-downloads
Austin – https://data.austintexas.gov/Public-Safety/Crime-Reports/fdj4-gpfu
Philadelphia – https://www.opendataphilly.org/dataset/crime-incidents
San Francisco – https://www.sanfranciscopolice.org/stay-safe/crime-data/crime-dashboard
Latest Posts
 Sample CRIMECAST Reports

Terms Of Use | Privacy Policy | Accessibility
© 2020-2024 CAP Index, Inc. All Rights Reserved.
Site Designed by R2 Creative Group