COVID-19 & Crime Issue #9 – How did the Pandemic Impact 2020 Crime in Major Cities Across the Country?
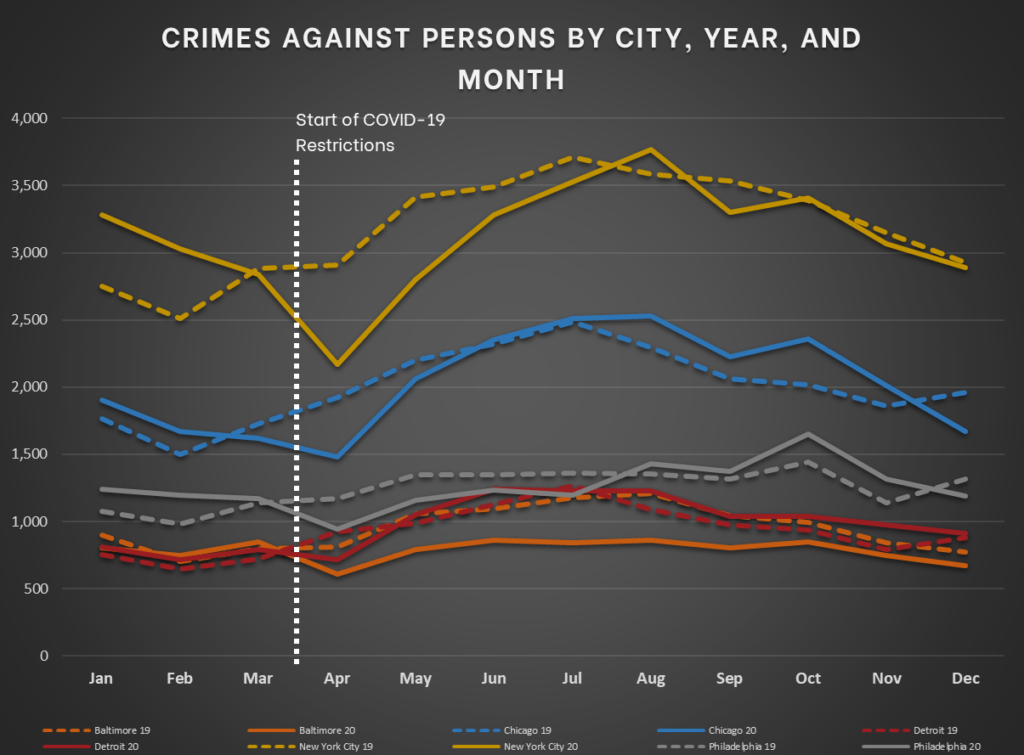
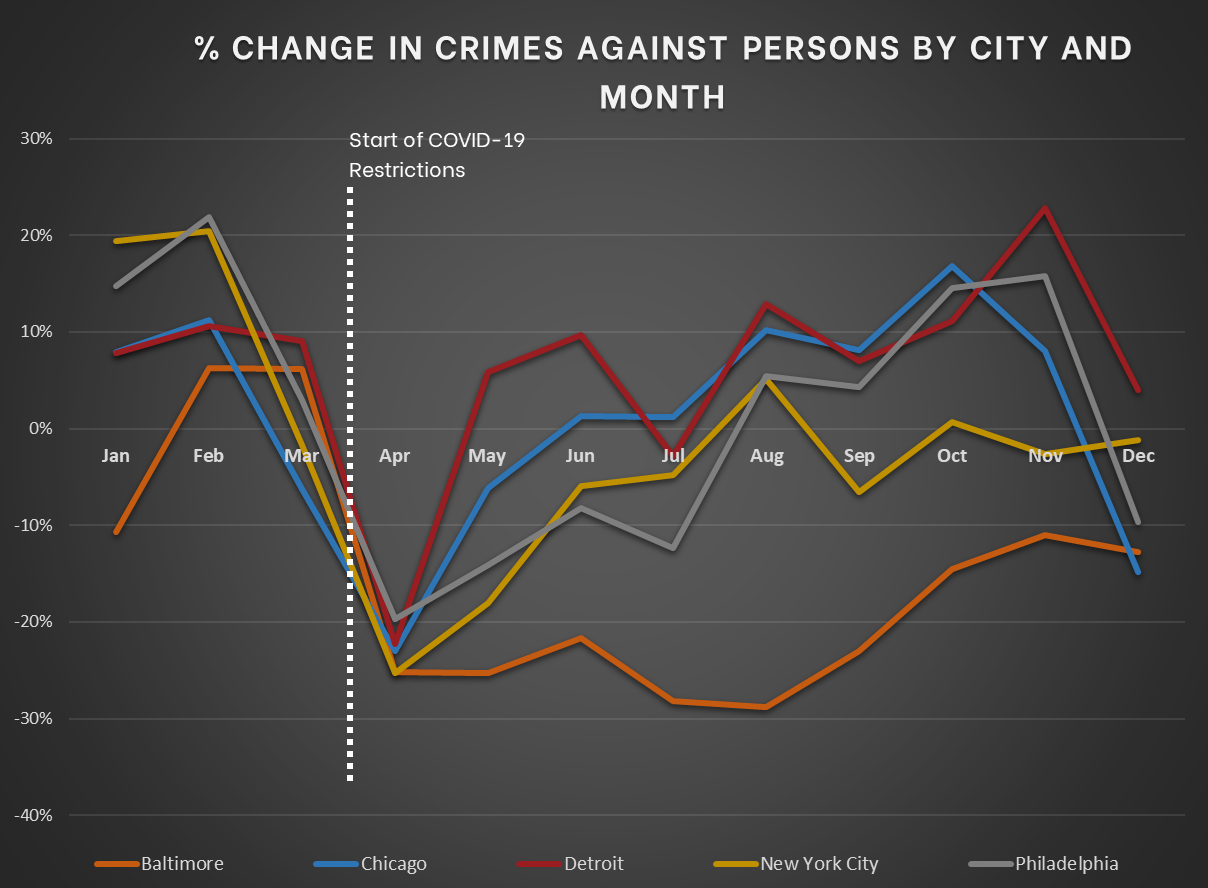
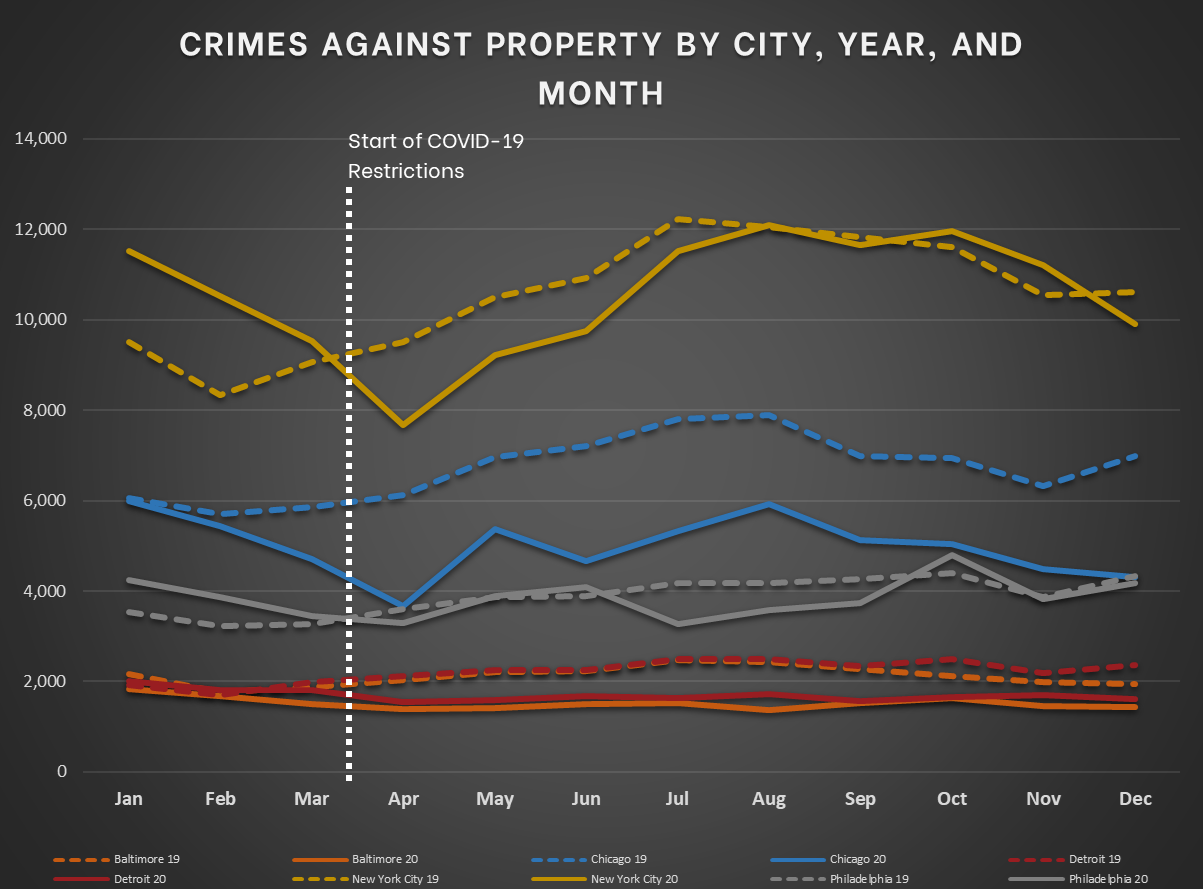
The COVID-19 pandemic has had a significant impact on crime. In issue #7 of our COVID-19 & Crime Series, we focused on 2020 versus 2019 crime trends for the first half of each year in 11 cities across the United States. In this issue, we will examine full-year data for 14 cities, with a special focus on the second half of each year. In the sections below, we will present paired graphs. The first shows separate 2019 and 2020 trend lines for each city. The second presents a single line for each city indicating the percentage change in crime for each month. [Example: Baltimore had 899 Crimes Against Persons in January 2019 compared to 803 in January 2020. This is an 11% decrease.] Extensive tables of all of the underlying data can be found at the bottom of this publication. Please note that the numbers here are subject to any biases in police reporting. Those biases might be magnified by COVID-19.
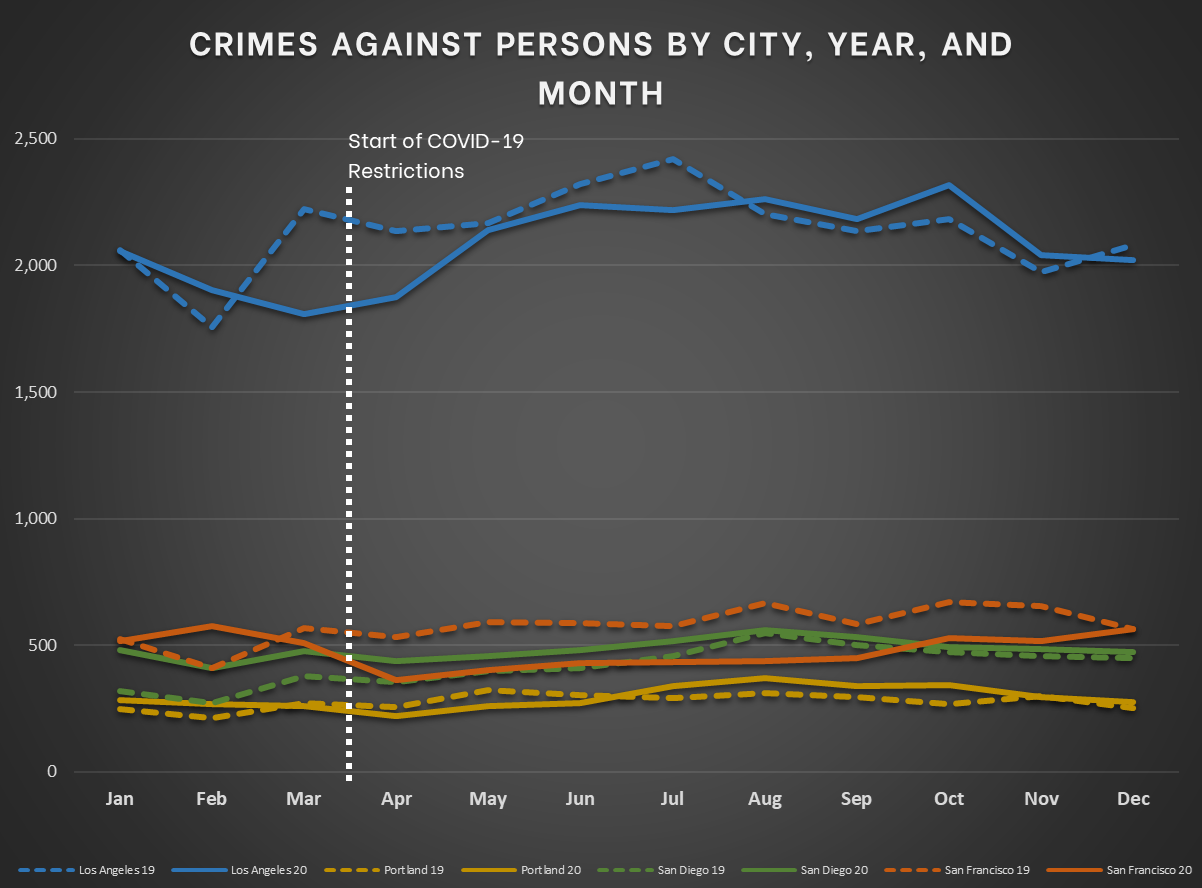
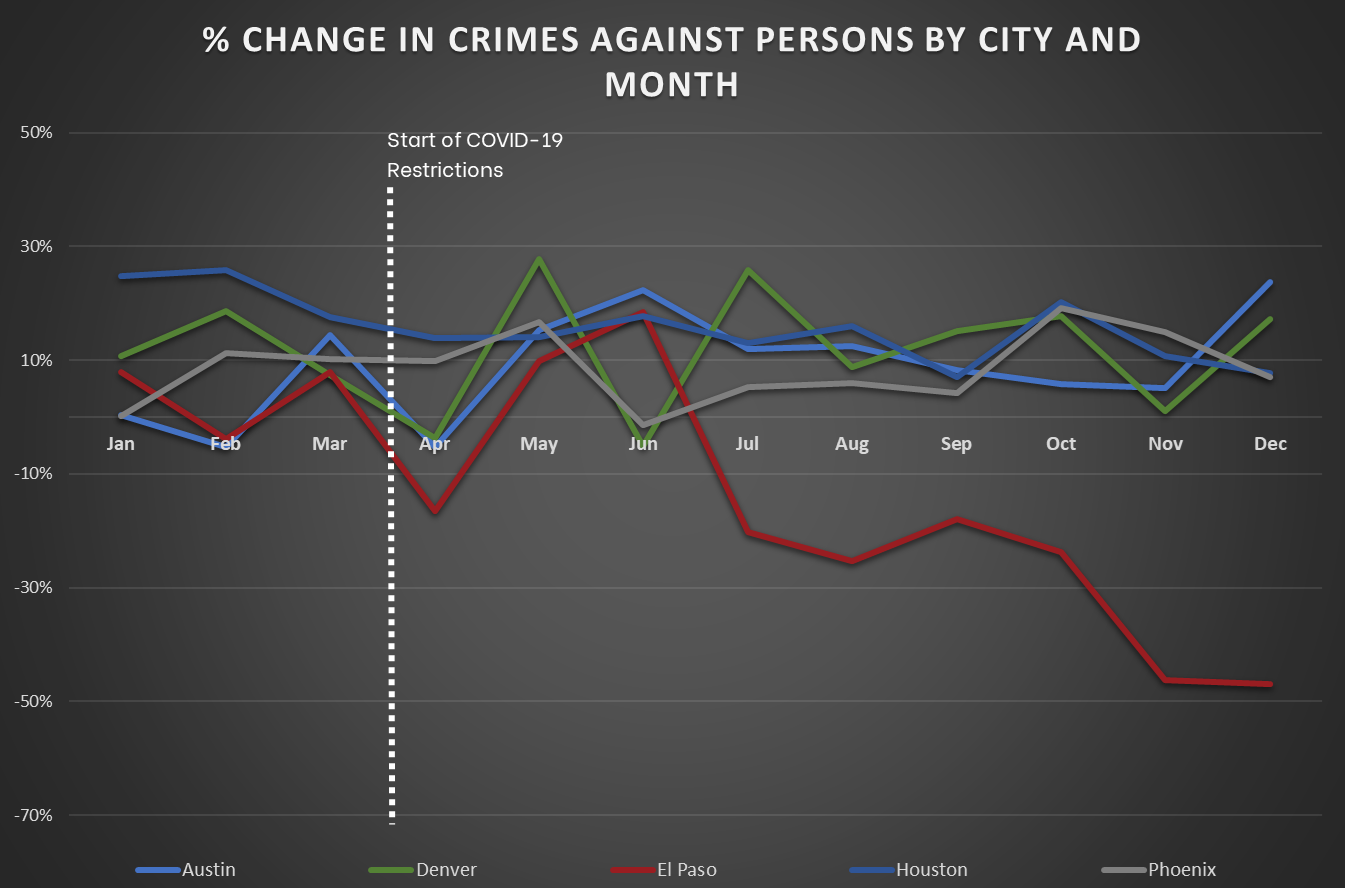
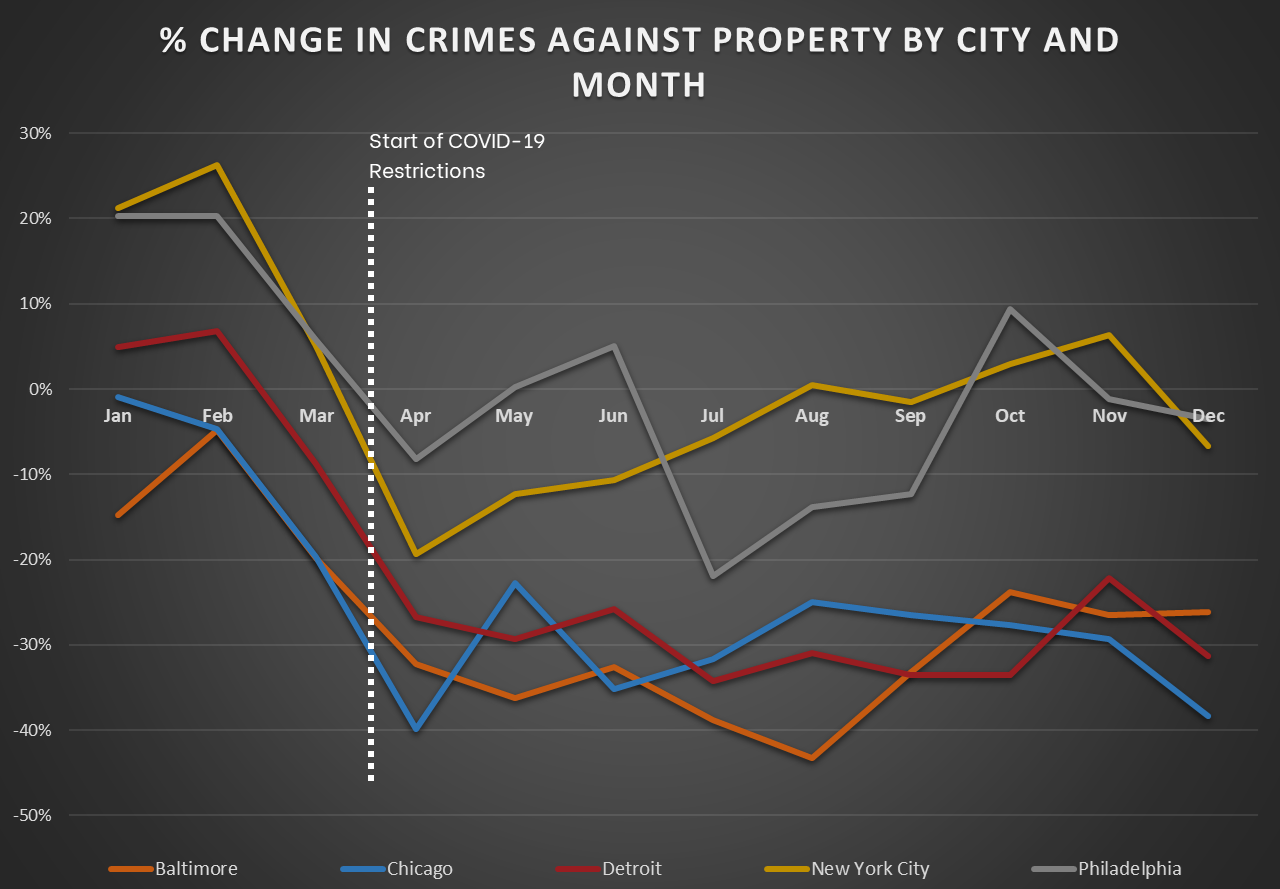
Most cities show a drop in crime after COVID-19 restrictions were instituted in March, especially for crimes against persons. Three obvious exceptions to this are for San Diego, Houston, and Phoenix, which showed surprisingly elevated persons crime reports for the first half of 2020. The pattern is less clear for property crimes. However, COVID-19 may have had a differential impact on various categories of property crimes. For example, some store closures may have increased some commercial burglaries, while lockdowns decreased residential burglaries. Similar displacements may have occurred with other property crime categories, with all of this complicated with changes in crime reporting and police response protocols.
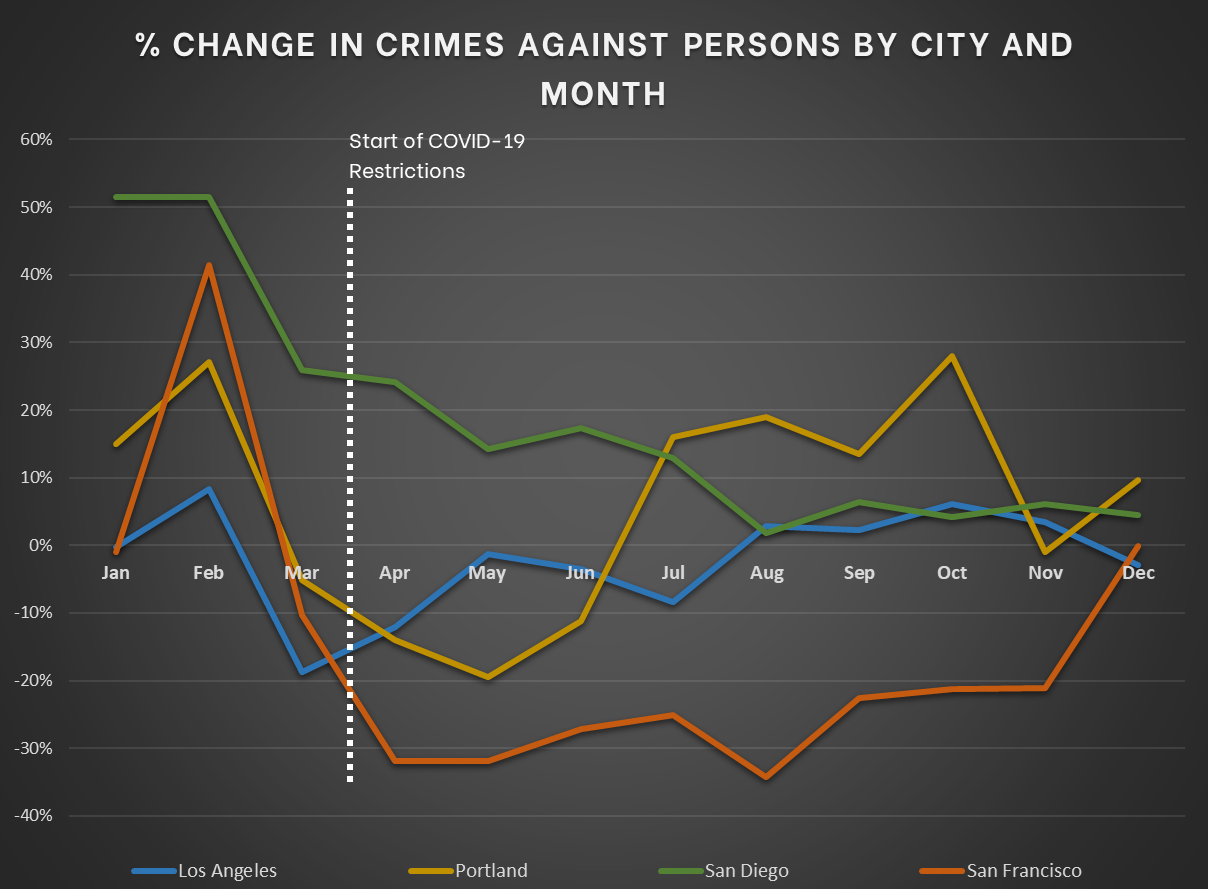
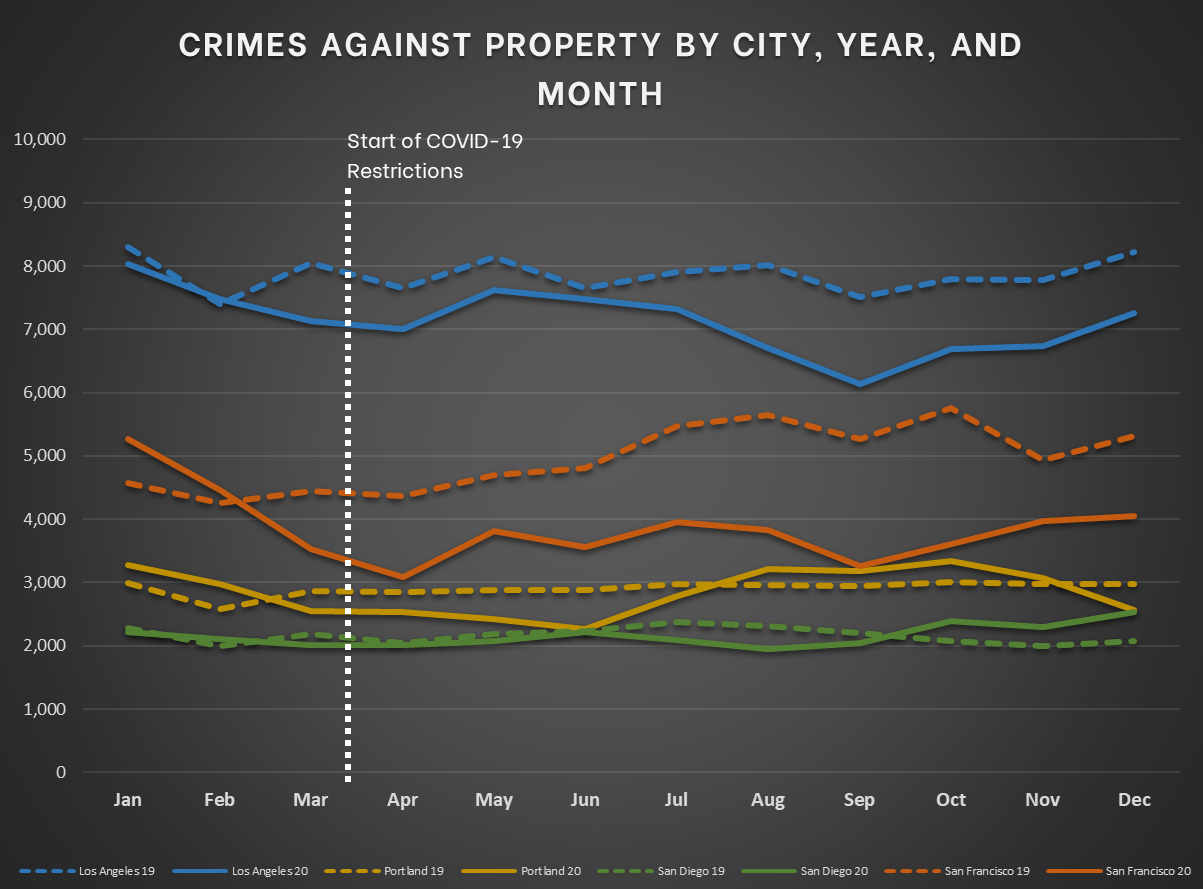
Focusing on the second half of the year, only three cities show significantly lower crimes against persons in 2020: Baltimore, San Francisco, and El Paso. All others showed increases of varying magnitude or remained comparable to 2019 levels. On the other hand, property crimes tended to show significant decreases or remained comparable in the second half of the year for most cities. Two exceptions are San Diego and Denver, which trended above 2019 levels.
CHARTS SHOWING TRENDS FOR CRIMES AGAINST PERSONS
Crimes Against Persons in Northeast and Midwest Cities
Crimes Against Persons in Pacific Cities
Crimes Against Persons in Mountain and South Central Cities

CHARTS SHOWING TRENDS FOR CRIMES AGAINST PROPERTY
Crimes Against Property in Northeast and Midwest Cities
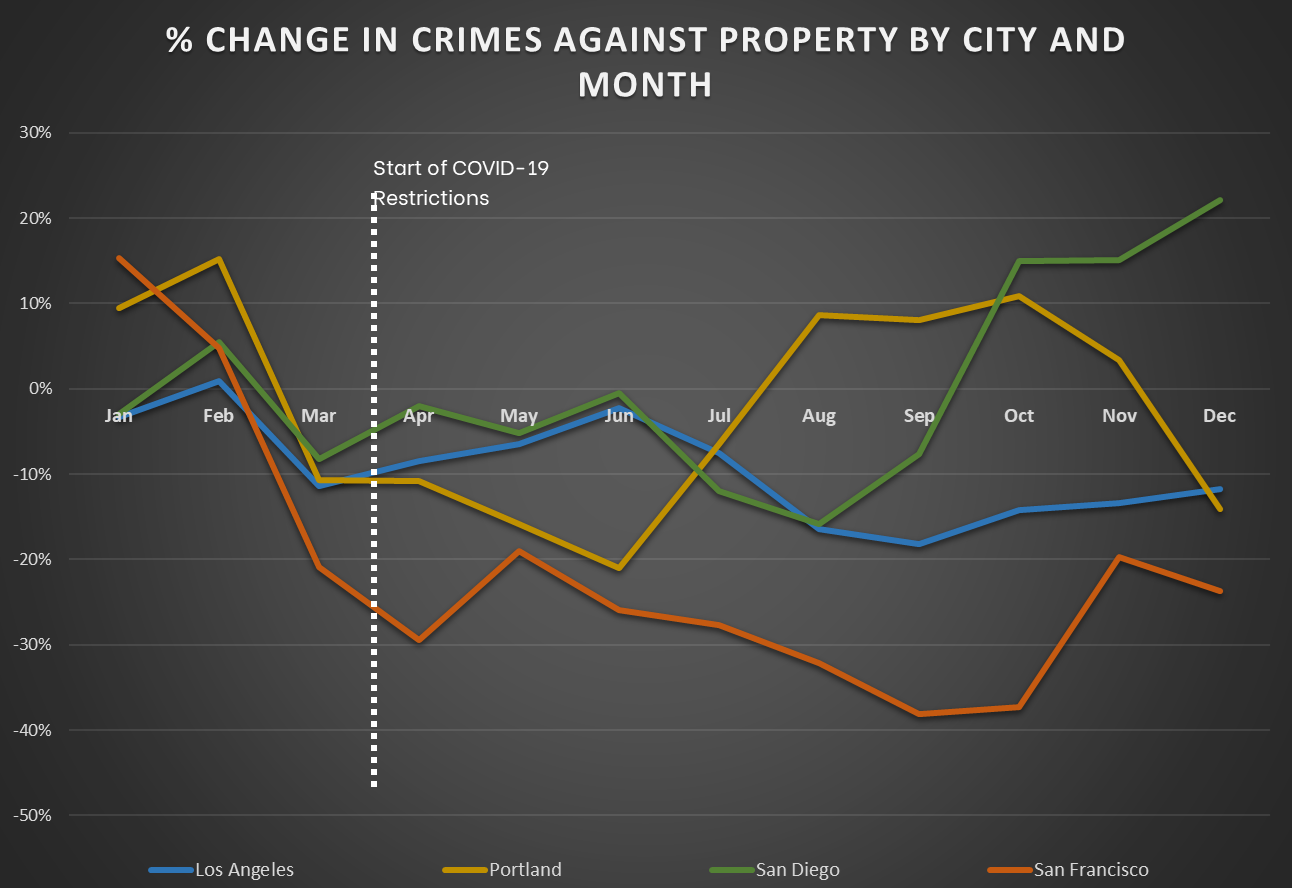
Crimes Against Property in Pacific Cities
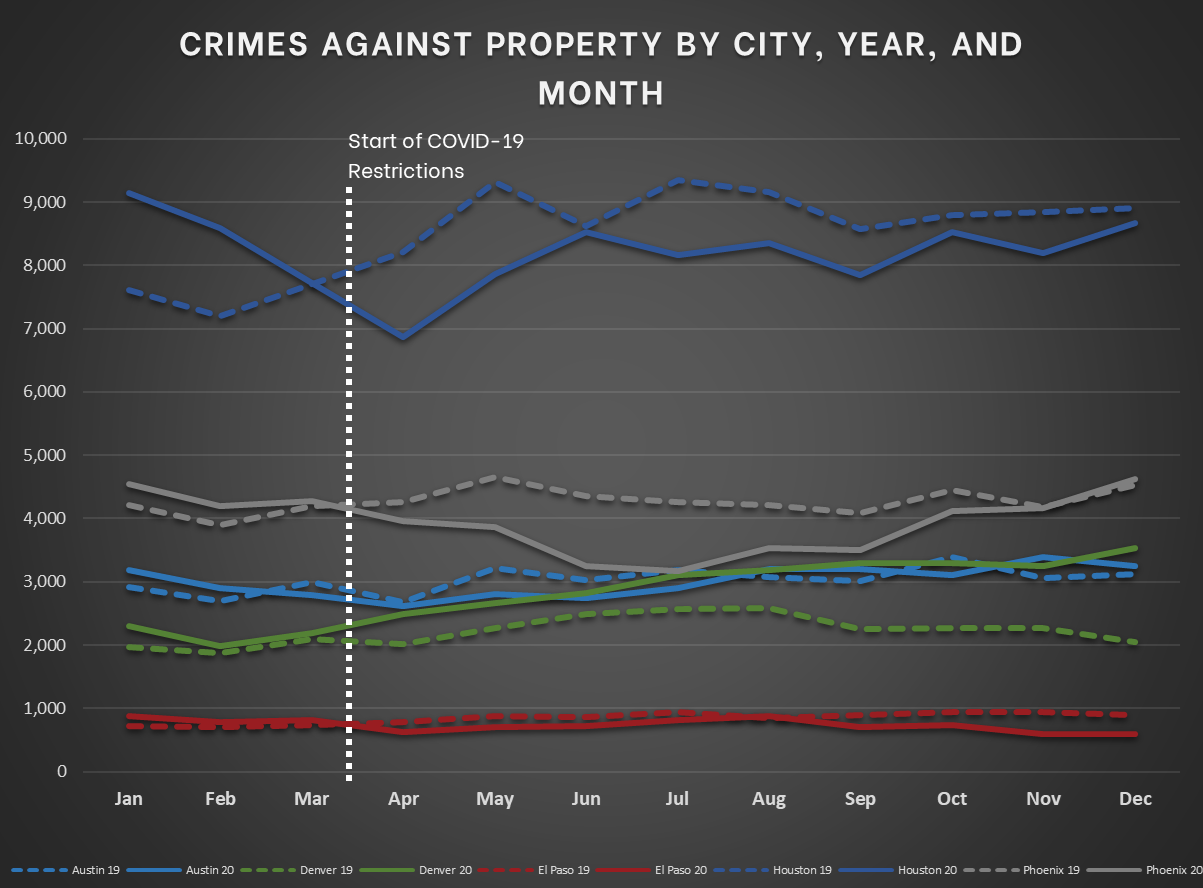
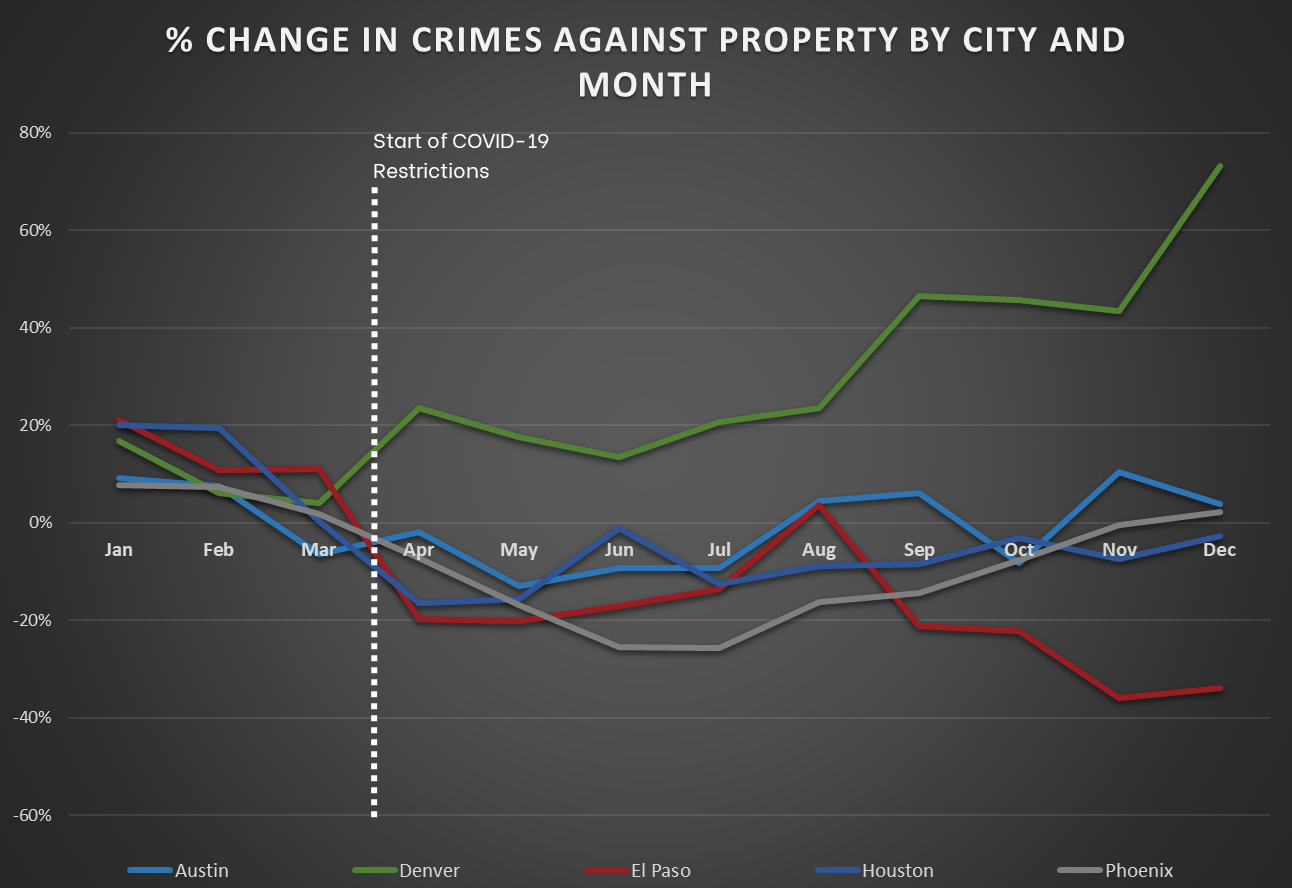
Crimes Against Property in Mountain and South Central Cities
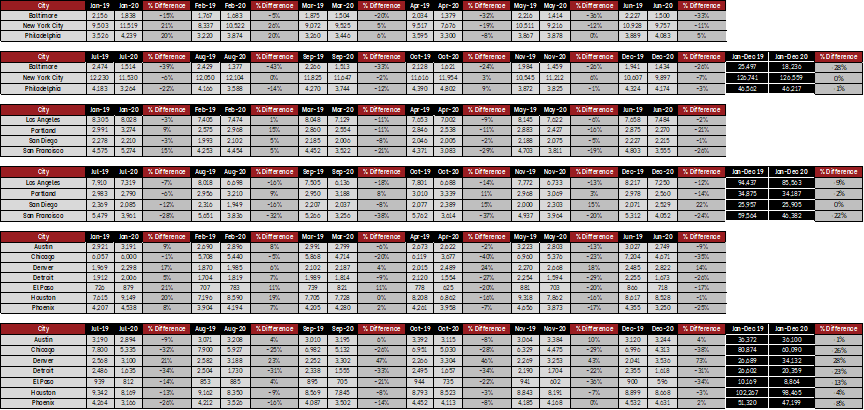
TABLES FOR CRIMES AGAINST PERSONS
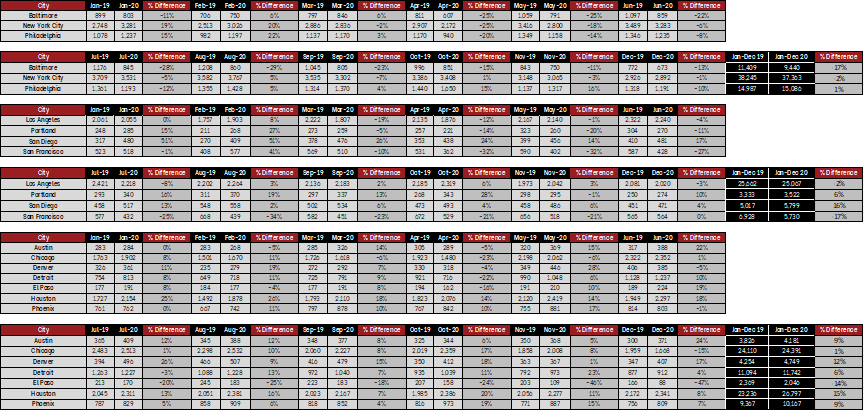
TABLES FOR CRIMES AGAINST PROPERTY
It is critical to have the best data to assess crime risk during this period and CAP Index is here to help. Contact CAP Index to discuss how we can help your organization dive deeper into these numbers and analyze crime trends for specific categories.
Latest Posts
 Sample CRIMECAST Reports

Terms Of Use | Privacy Policy | Accessibility
© 2020-2024 CAP Index, Inc. All Rights Reserved.
Site Designed by R2 Creative Group