COVID-19 & Crime Issue #8 – New York City Crime Study from January to June 2020
In the last couple of months, there have been reports in the media of select violent crime increases across the country, especially shootings, as COVID-19 dynamics continue to evolve. As part of Issue #7 in our series on COVID-19 & Crime, the analytics team at CAP Index investigated these reports by gathering crime counts this year and last year from select police departments across the United States. In this issue, we dive deeper into crime trends in New York City (NYC).
OVERALL CRIME TRENDS IN NEW YORK CITY
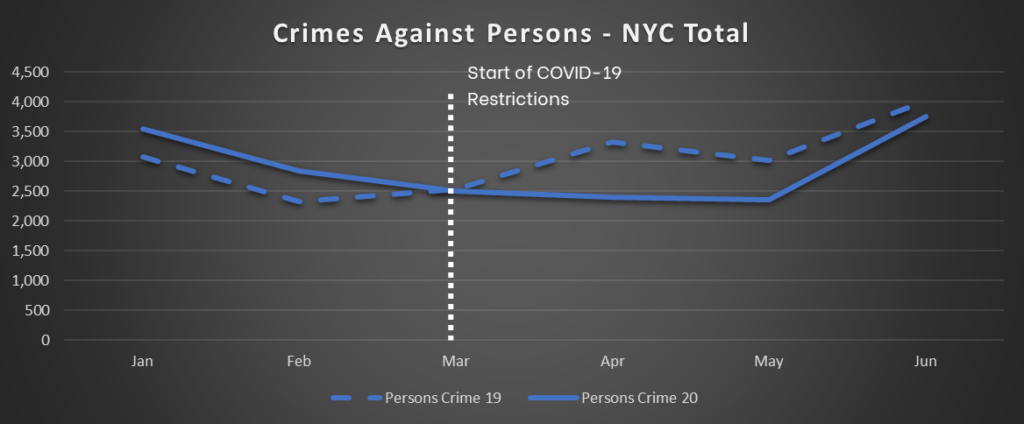
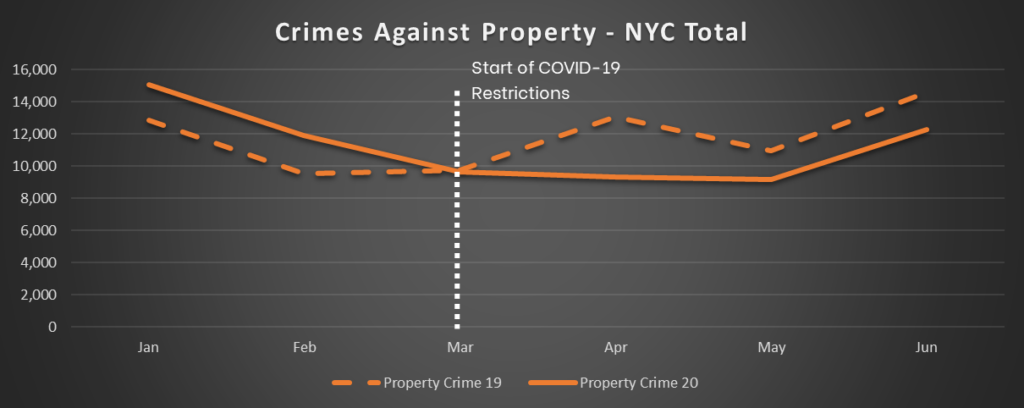
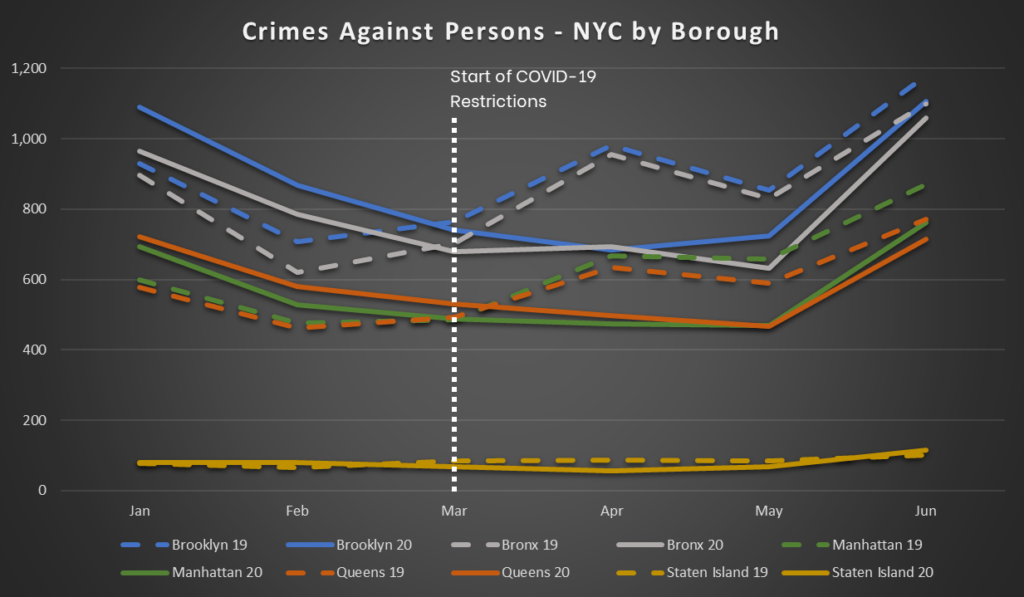
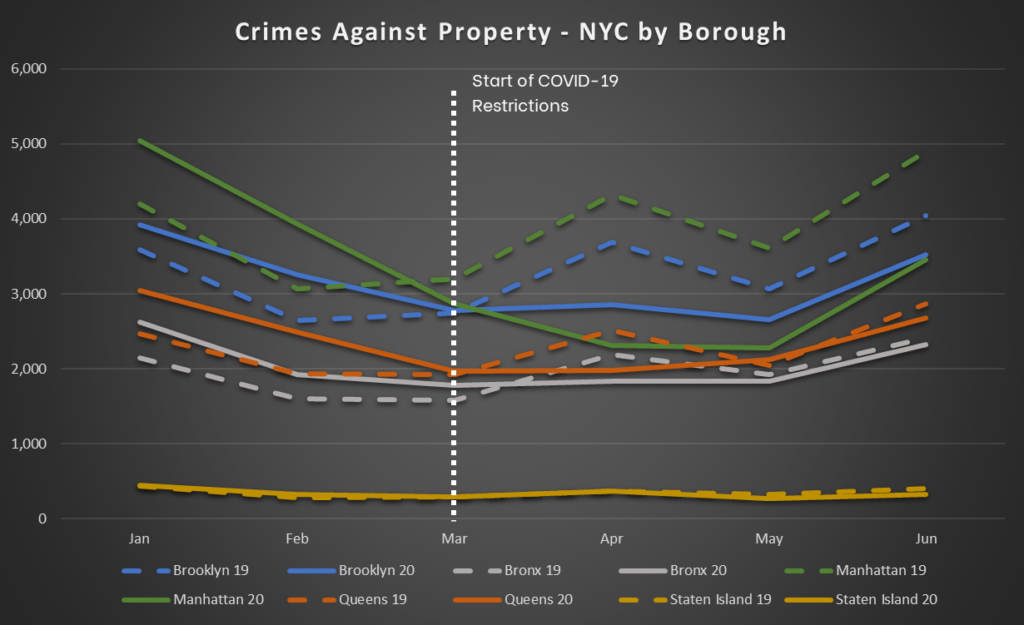
We begin with an assessment of overall crime trends and then move to an analysis of shooting incidents. NYC shows a dramatic pattern in terms of the impact of COVID-19 on crime in the city. Both persons and property crimes are significantly higher in January and February of this year, drop to the same level as last year in the transitional month of March, and then remain significantly below last year’s counts in April through June. Please note an upward violent crime trend in May and June similar to what is being reported in the media. However, a comparable upward trend was also present in 2019. So perhaps this is a seasonal phenomenon. NYC boroughs follow the citywide trends with the exception of Staten Island where June’s violent crimes were above last year’s level and March and April property crimes were comparable to 2019 counts. Finally, please note that Manhattan’s property crime counts were the highest of all boroughs (unlike crimes against persons) in 2019, but they decreased significantly and dropped below Brooklyn’s level in 2020 once COVID-19 restrictions took place.
The charts below reflect trends for Crimes Against Persons and Crimes Against Property from January to June of 2020 for all of NYC and then broken down by borough:
ANALYZING SPECIFIC CRIMES
Continuing with our analysis, we dive deeper into specific crime types within the persons and property categories for the city as a whole as well as individual boroughs. Below are several notable citywide trends when comparing this year with last year:
- Murder – 2020 fell somewhat below 2019 in January – February, followed by a very significant increase after the transitional month of March.
- Rape – There was a mixed trend in January – February, followed by a significant decrease thereafter.
- Robbery – 2020 increased significantly in January – February, followed by a decrease after the transitional month of March.
- Felony Assault – 2020 increased somewhat in January – February, followed by a decrease that flattens out in June. With recent reports of increased shootings, one might have expected a higher level of Felony Assaults by the end of this time period. However, this category includes a variety of assaults beyond those involving shootings. We also suspect some underreporting within this crime type, which might have been accentuated by COVID-19.
- Burglary – 2020 shows a continuous increase, especially in June. Some of that could be attributed to widespread business closures due to COVID-19 as well as looting during the George Floyd protests.
- Grand Larceny – There was an initial increase, followed by a significant decrease.
- Grand Larceny Auto – 2020 shows a large continuous increase across the six months.
- Petit Larceny – There was an initial increase, followed by a decrease.
There are a variety of factors that one might consider when attempting to explain these trends:
- COVID-19 pandemic and various restrictions/economic challenges/business closures/interpersonal tensions associated with it
- reduced and redeployed law enforcement resources
- civil unrest and brazen behavior
- lack of trust in police, which could affect incident reporting
- increased gun sales
- offenders released from prison due to COVID-19
- seasonal trends
It may take some time for criminologists to draw causal conclusions about these trends. CAP’s analytics team will continue to monitor these statistics and provide periodic analyses.
SHOOTINGS IN NYC
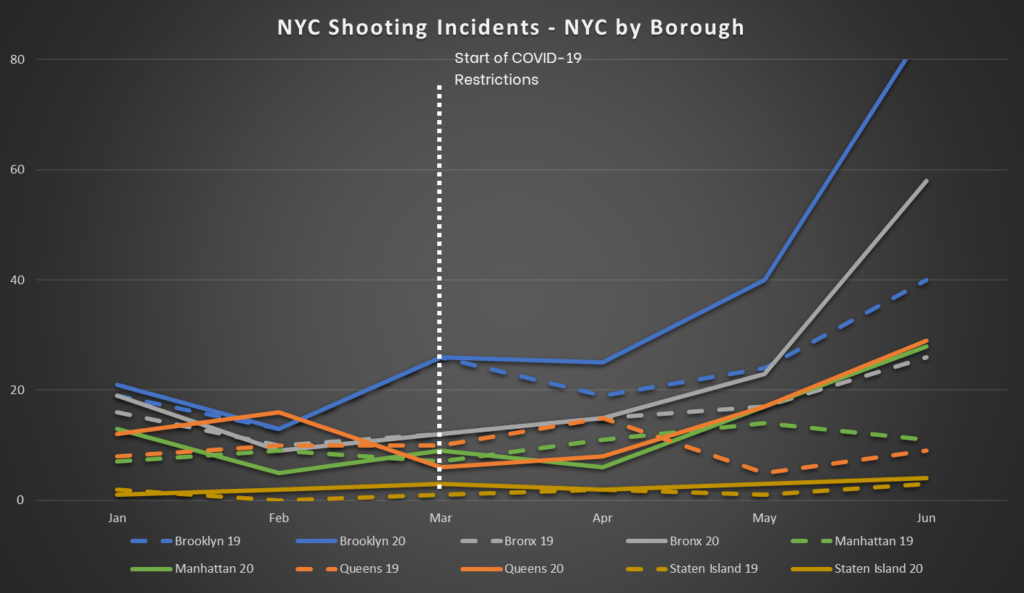
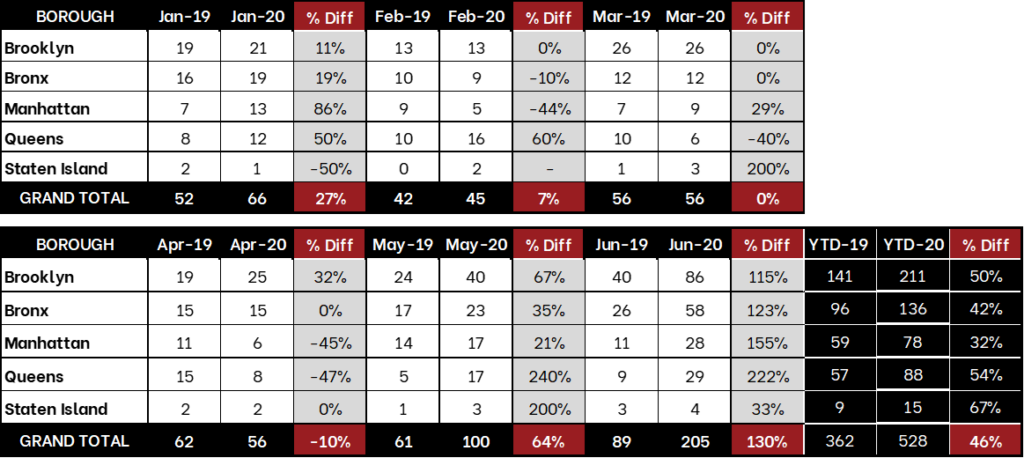
We now shift to what has been the focus in the media recently – gun violence. With a significant increase in murders, it is not at all surprising to find a comparable upward trend in shooting incidents. As is evident within the table and graph below, initially mixed trends turned into notable increases in shootings in May and June when compared to the same time frame last year. This pattern is consistent across all boroughs. Recent media reports suggest that this increase continues into July and August. We will report on that once address-specific data become available.
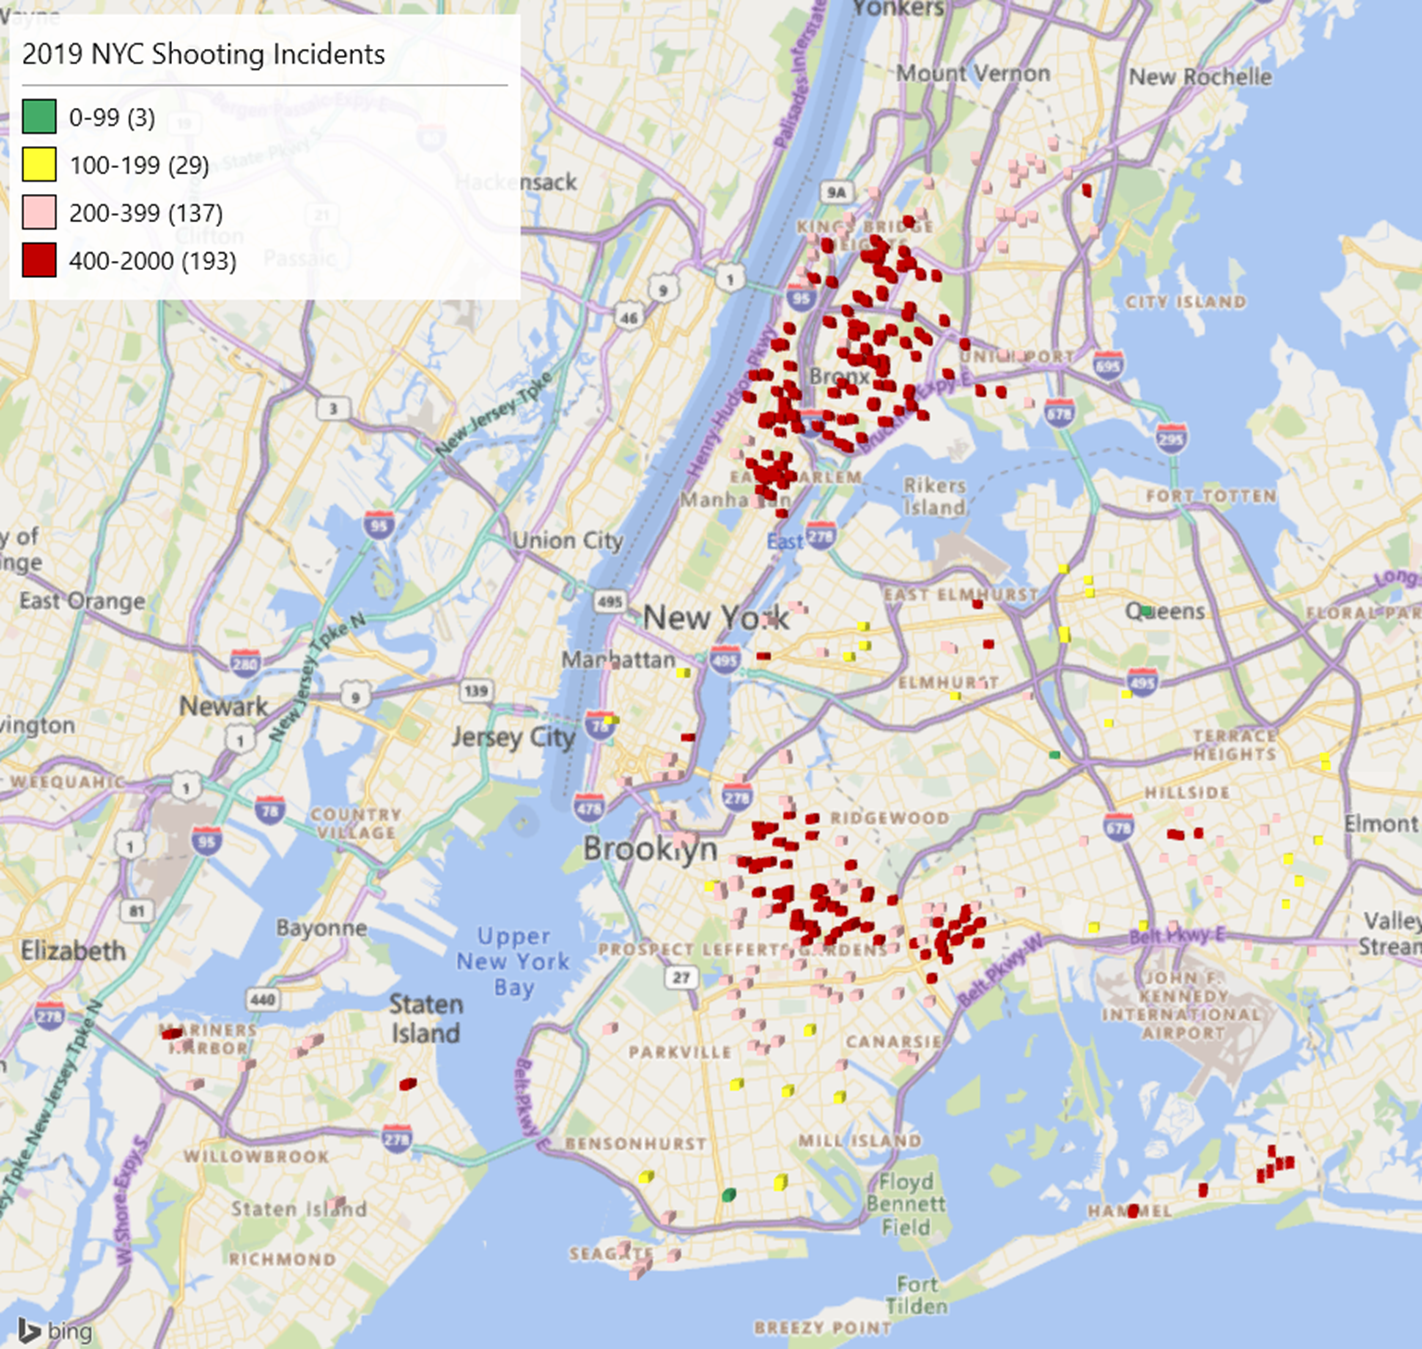
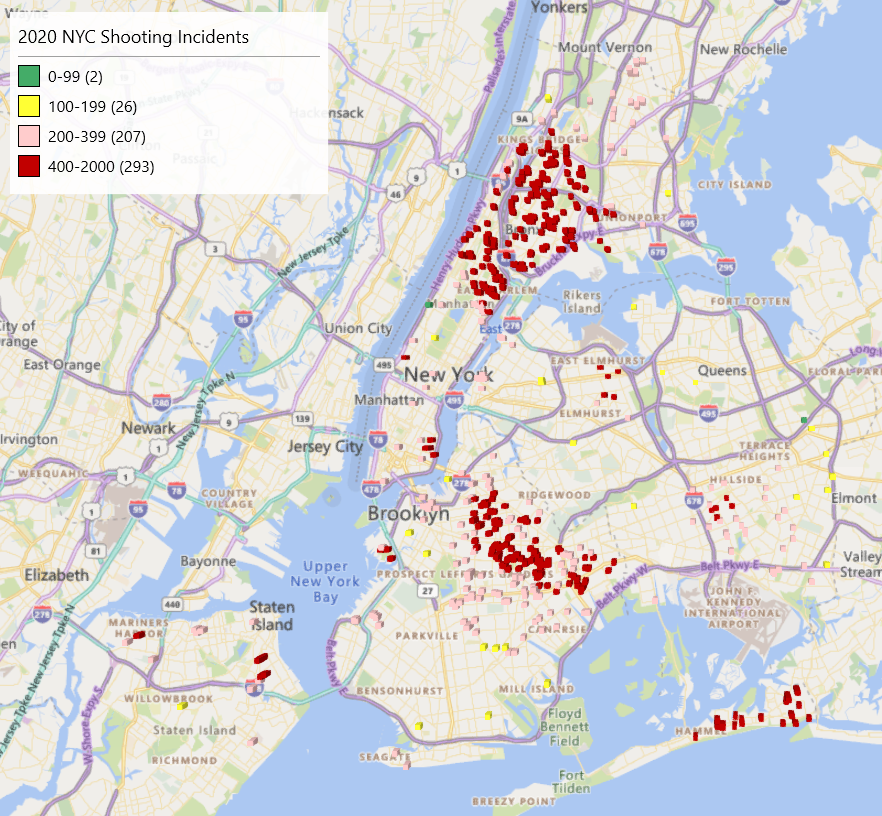
For the following graphics, 2019 and 2020 shooting incidents were mapped and shaded based on the CAP Score for the location of each incident. As is evident in the maps below, the vast majority of shootings occurred in elevated risk areas as determined by the CAP Scores. Please note that these incidents tend to be concentrated within certain sections of the city including Harlem in Manhattan, the northern part of Brooklyn, and most of the Bronx.
It is critical to make sure you have the best data to assess crime risk during this period and CAP Index is here to help.
Contact CAP Index to discuss how we can help your organization dive deeper into these numbers and analyze crime trends for specific categories.
SOURCES:
https://compstat.nypdonline.org/2e5c3f4b-85c1-4635-83c6-22b27fe7c75c/view/89
https://data.cityofnewyork.us/Public-Safety/NYPD-Shooting-Incident-Data-Year-To-Date-/5ucz-vwe8
https://data.cityofnewyork.us/Public-Safety/NYPD-Shooting-Incident-Data-Historic-/833y-fsy8
Latest Posts
 Sample CRIMECAST Reports

Terms Of Use | Privacy Policy | Accessibility
© 2020-2024 CAP Index, Inc. All Rights Reserved.
Site Designed by R2 Creative Group