COVID-19 & Crime Issue #7 – How did COVID-19 & the George Floyd Protests Impact Crime in Major Cities Across the Country?
In the past few weeks, there have been reports in the media of violent crime increases across the country, especially shootings, as COVID-19 dynamics continue to evolve. As part of our series on COVID-19 & Crime, the analytics team at CAP Index investigated these reports by gathering crime counts this year and last year from police departments in 11 cities across the United States. CAP Index will continue to monitor these trends in the months ahead. Please note that the numbers here are subject to any biases in police reporting. Those biases might be magnified by COVID-19.
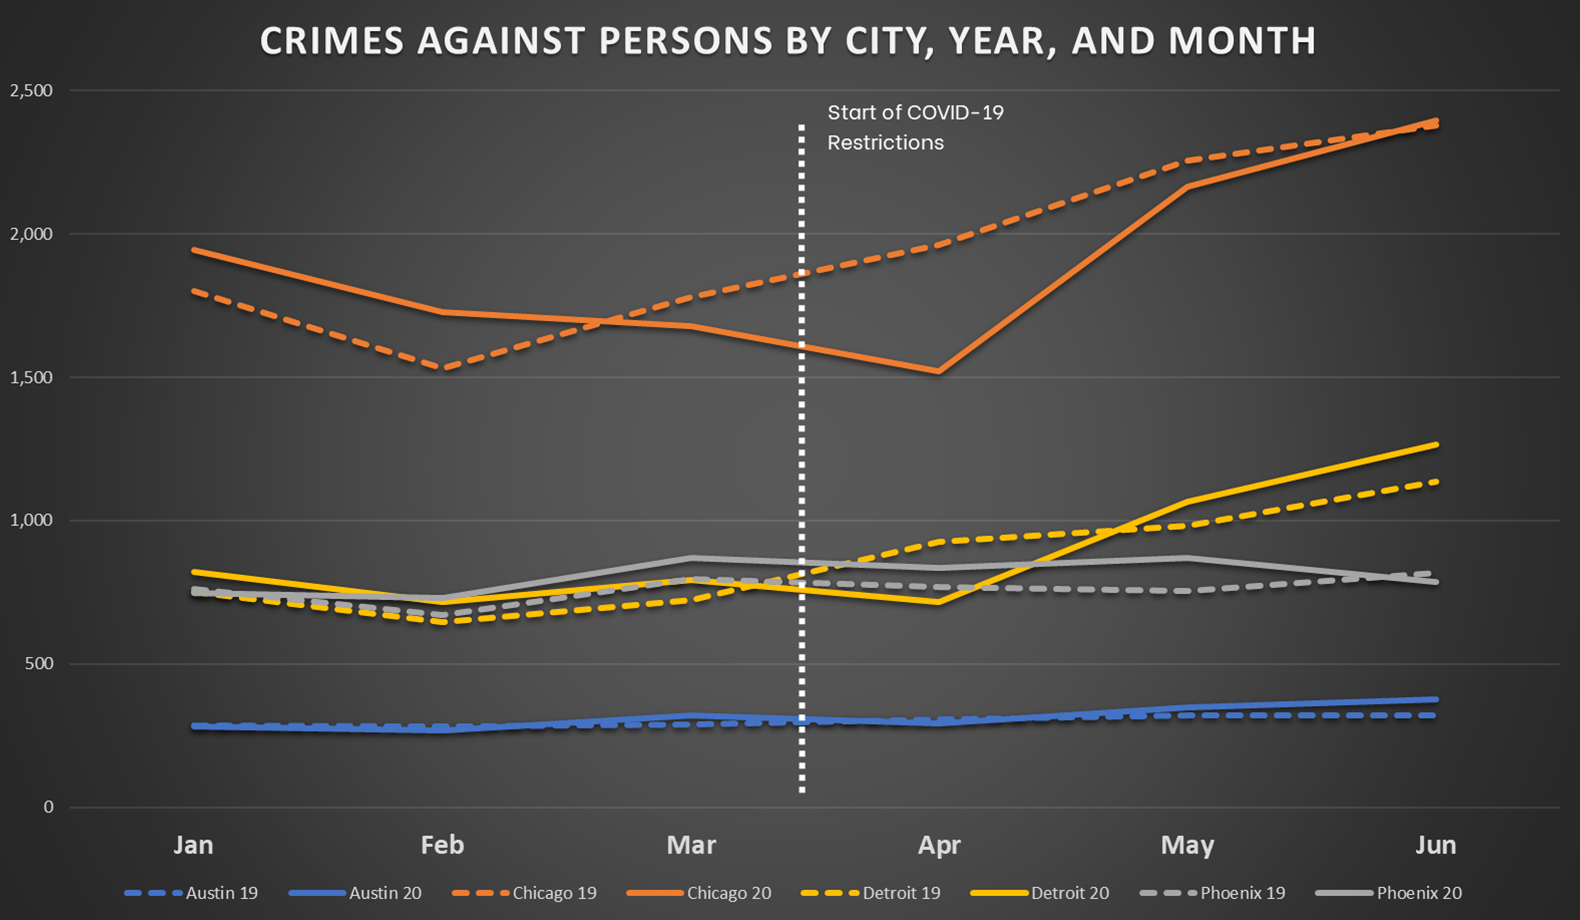
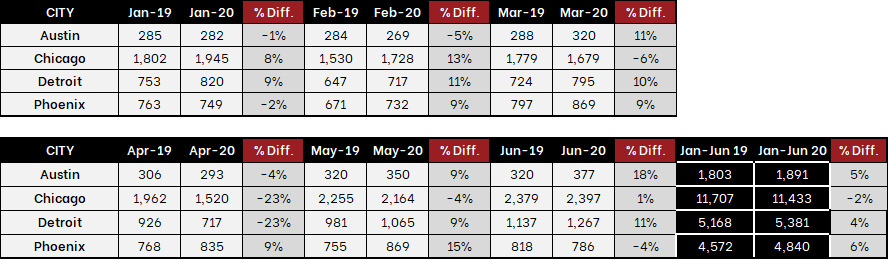
TRENDS FOR CRIMES AGAINST PERSONS
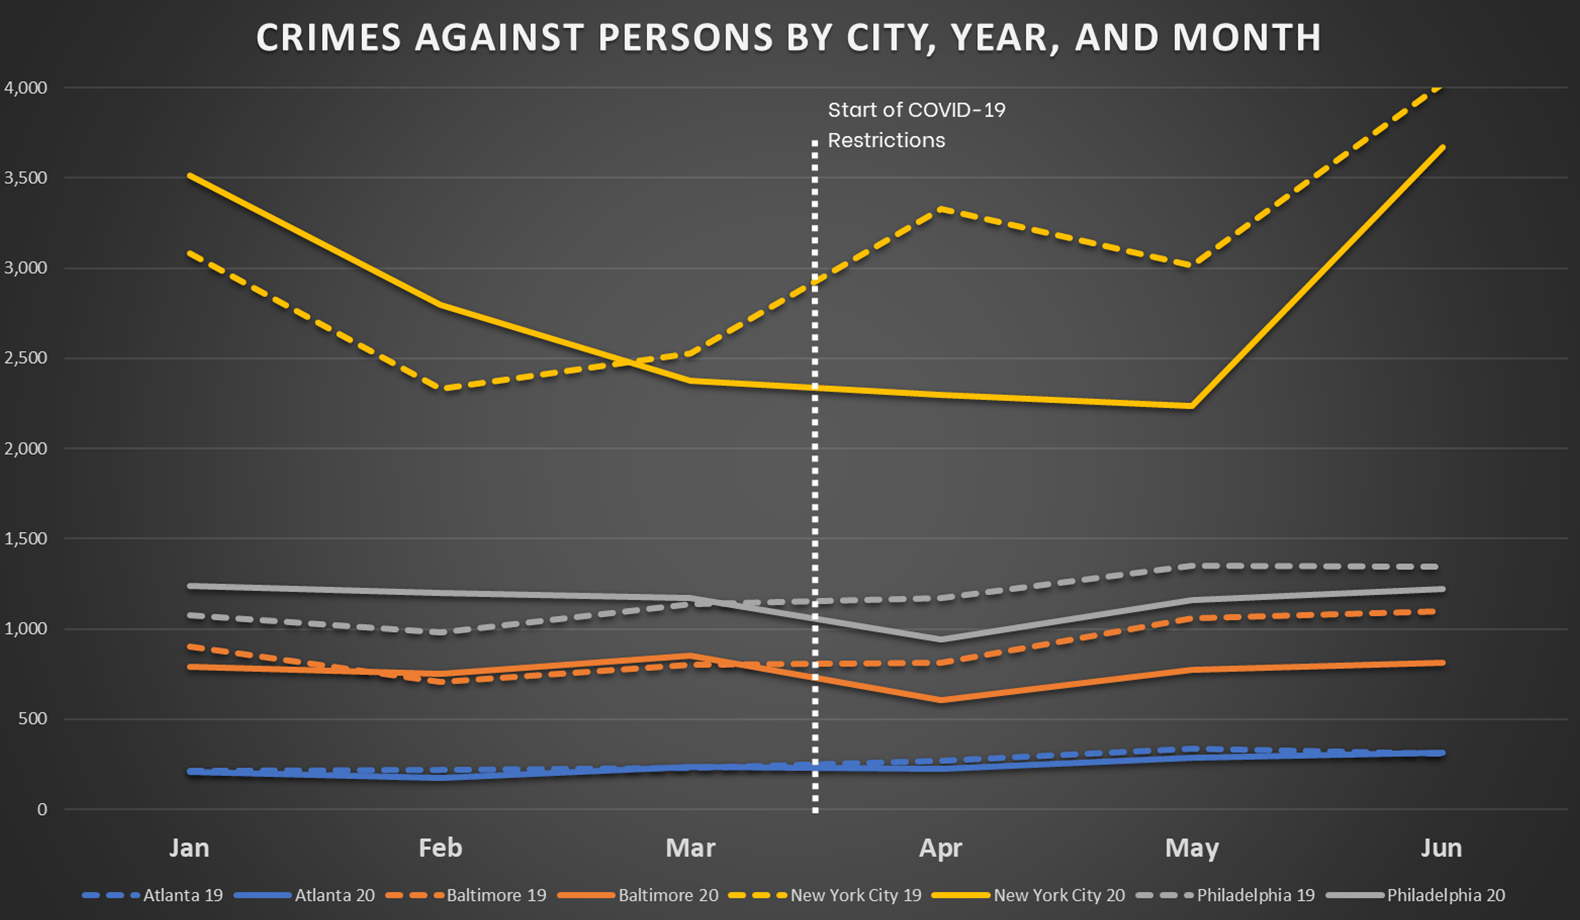
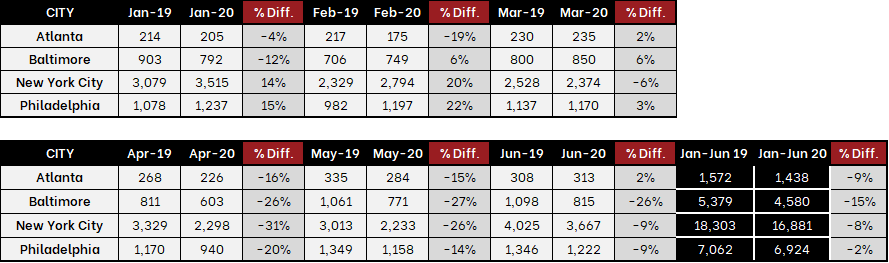
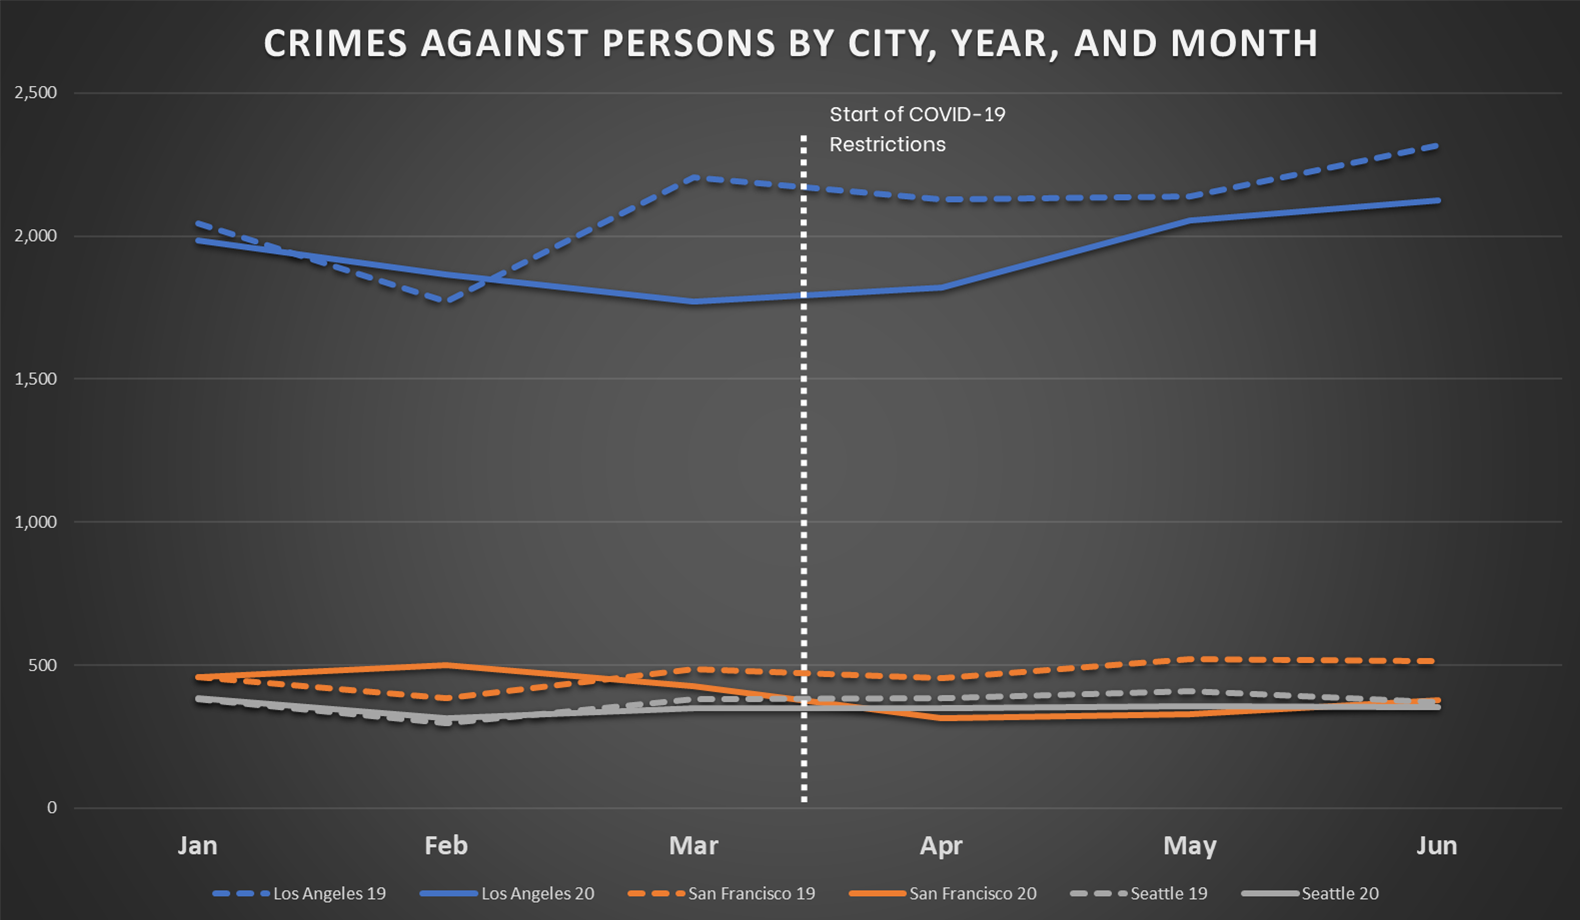
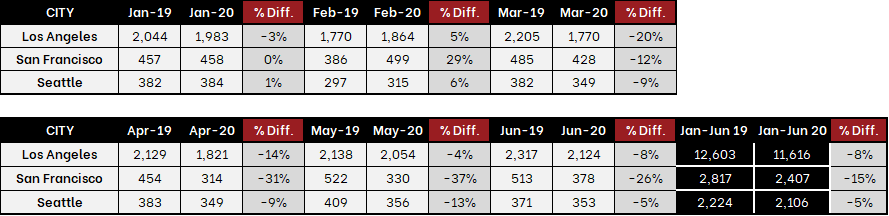
The charts below reflect trends for Crimes Against Persons in the Eastern, Western, and Central Cities. Looking at the Eastern Cities, we see that New York City shows a dramatic pattern in terms of the impact of COVID-19 on violent crime. Crime counts are significantly higher in January and February of this year, drop to the same level in the transitional month of March, and then remain significantly below last year’s counts in April through June. Other cities that start at or above last year’s crime counts at the beginning of the year and then fall below last year’s levels with the introduction of COVID-19 restrictions include Baltimore, Philadelphia, Los Angeles, and San Francisco. Chicago and Detroit start out the same way, but they rise above last year’s counts in May for Detroit and in June for Chicago. Atlanta, Austin, Phoenix, and Seattle are fairly flat from January to June for both years.
Four cities show upward violent crime trends in May and June like what is being reported in the media: Chicago, Detroit, Los Angeles, and New York. However, each of these cities showed similar upward trends last year. So perhaps this is just a seasonal phenomenon.
Crimes Against Persons by City, Year, and Month for Eastern Cities
Crimes Against Persons by City, Year, and Month for Western Cities
Crimes Against Persons by City, Year, and Month for Central Cities
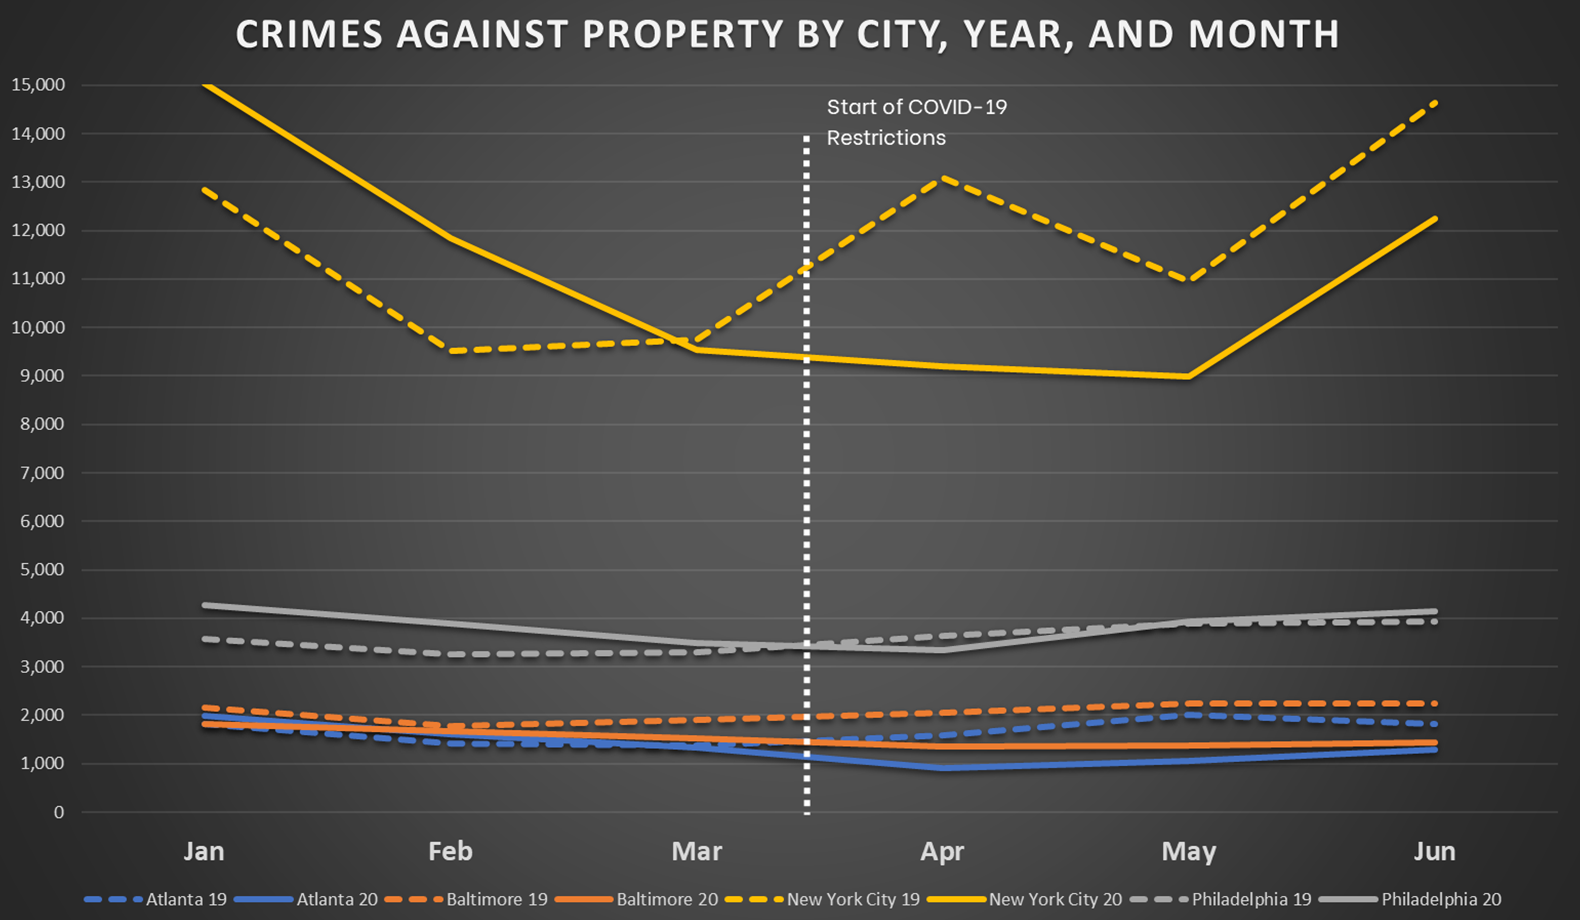
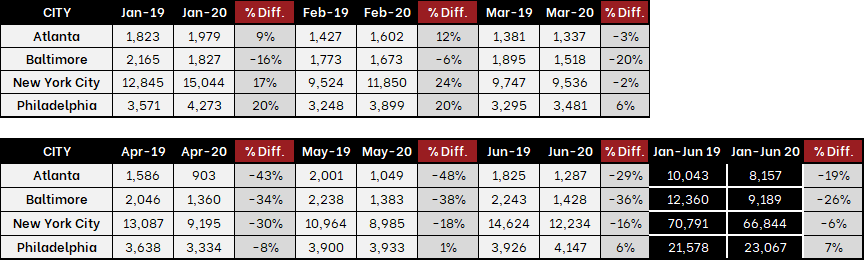
TRENDS FOR CRIMES AGAINST PROPERTY
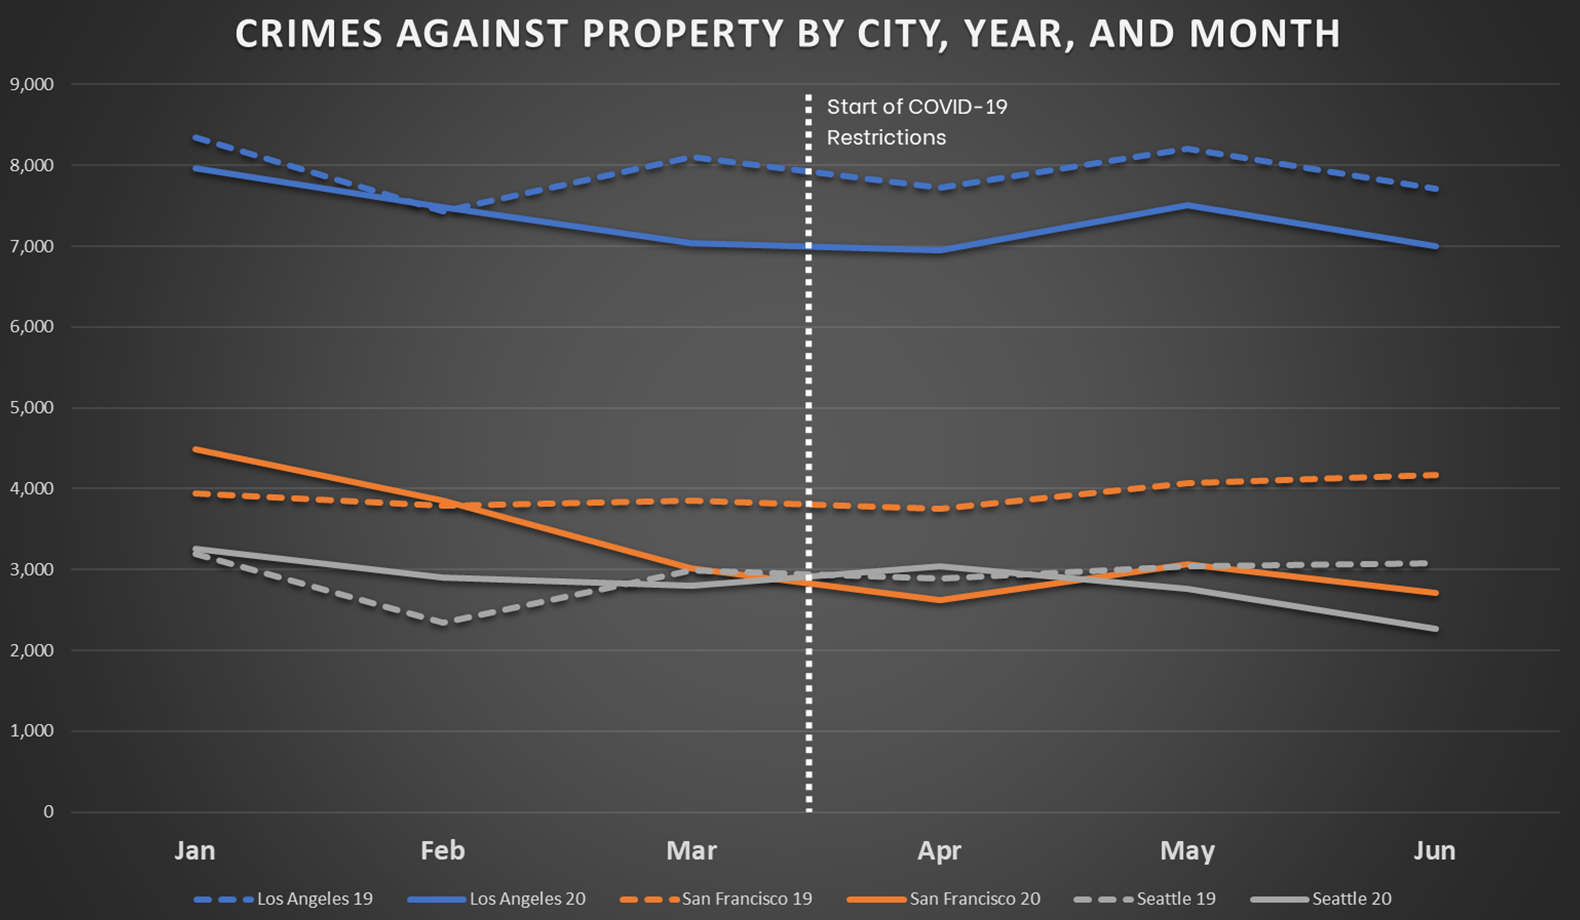
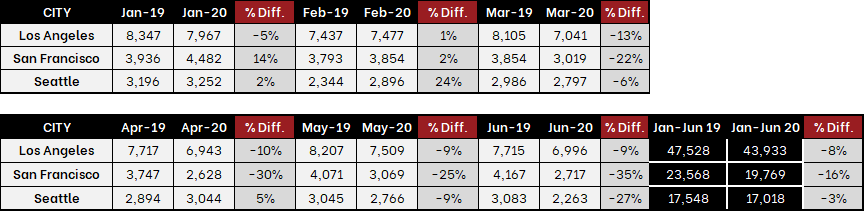
Looking at the charts for Crimes Against Property, we see that all 11 cities tend to show similar property crime levels or crime increases for the first two months of the year vs. last year, followed by decreases of varying magnitudes thereafter. The only two cities that slightly diverge from that pattern are Philadelphia and Seattle where this year’s property crime levels rise slightly above last year’s levels for a month or two between March and June. Clearly, COVID-19 has had an impact on decreasing property crime counts this year. Whether that is a result of actual crime decreases or changes in reporting is unknown at this time.
Crimes Against Property by City, Year, and Month for Eastern Cities
Crimes Against Property by City, Year, and Month for Western Cities
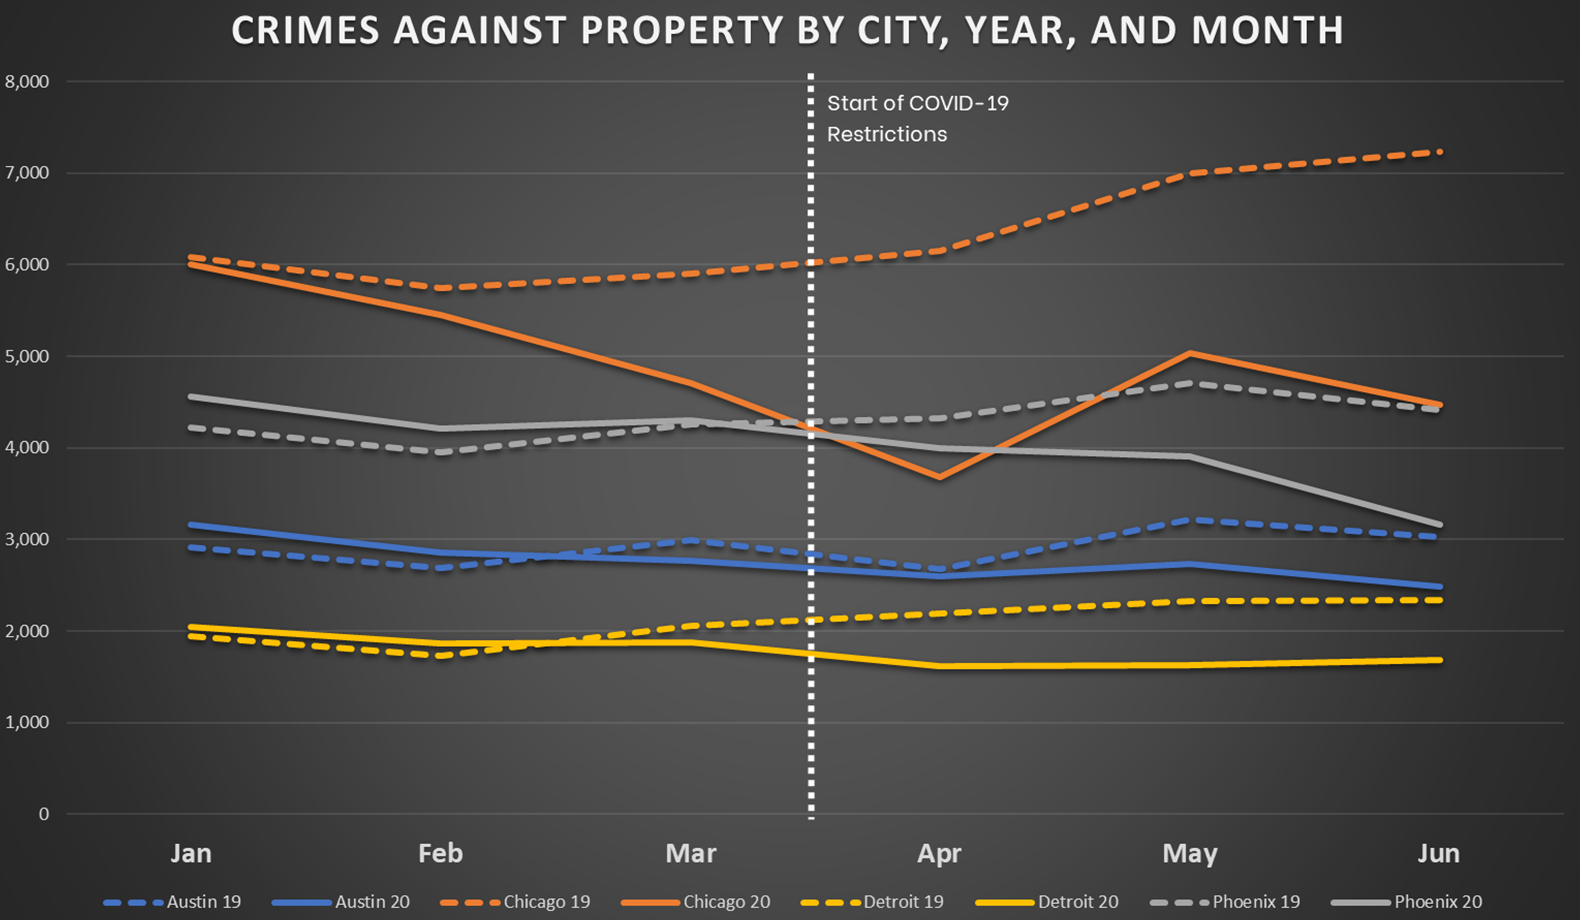
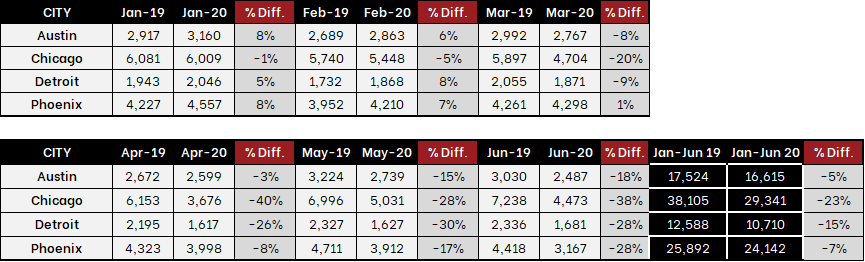
Crimes Against Property by City, Year, and Month for Central Cities
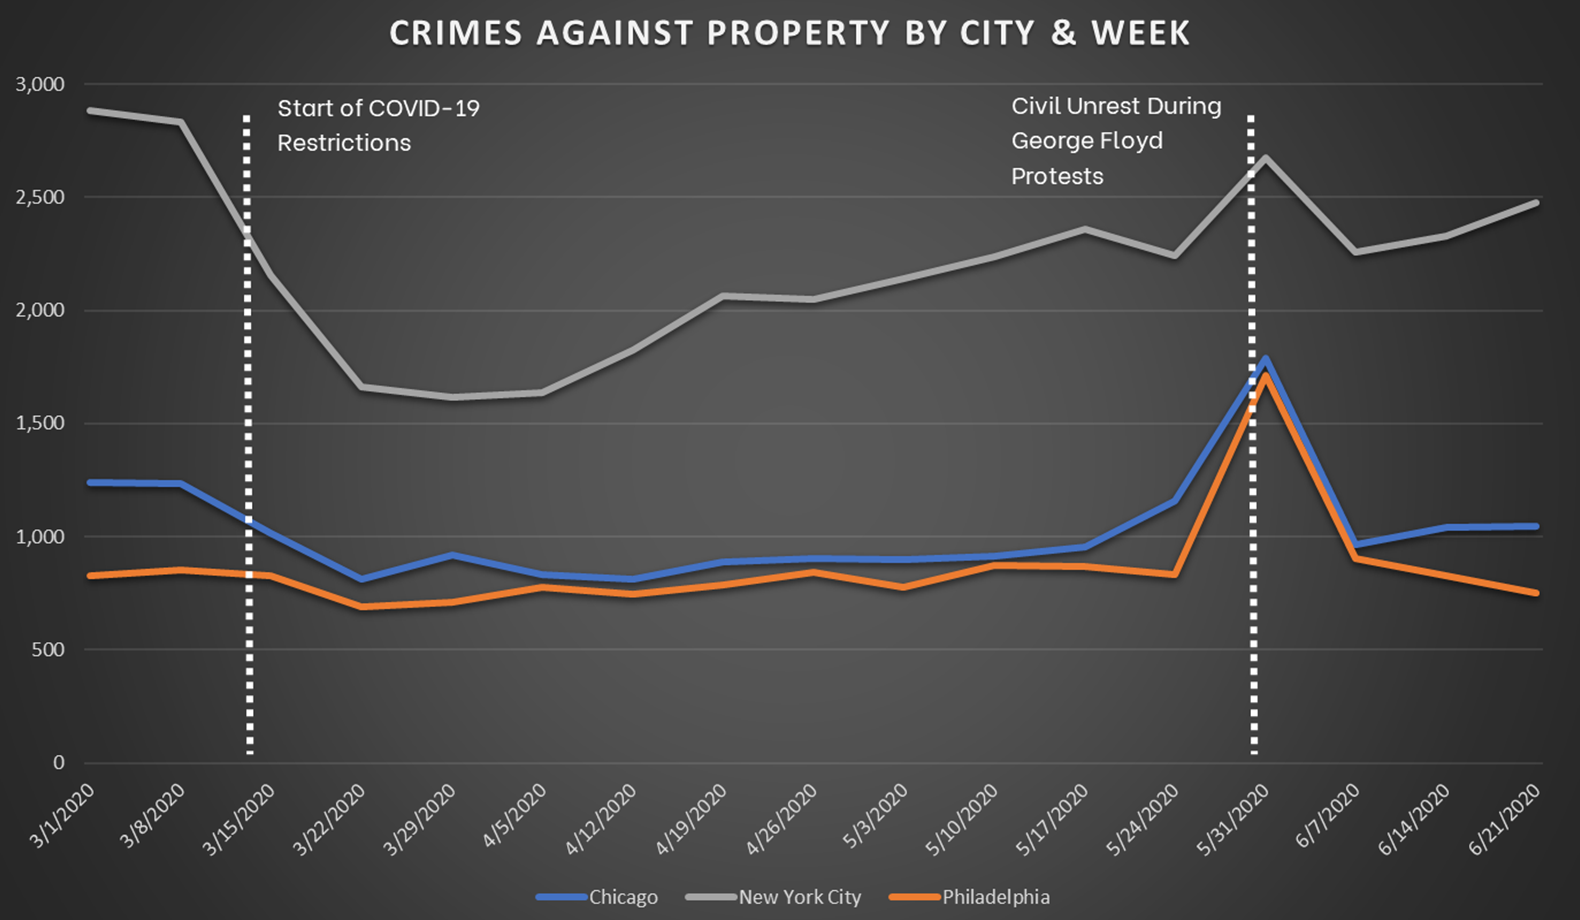
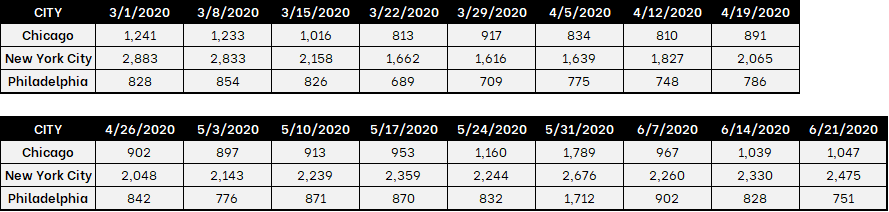
CIVIL UNREST FOLLOWING THE GEORGE FLOYD PROTESTS
There was much discussion in the media about property crimes that occurred as part of the George Floyd protests. Looking at weekly property crime data, we found only three of these 11 cities that showed property crime spikes during the week of May 24, 2020, when protests swept the country. Burglary and arson are two property crimes that resulted from rioting. Vandalism is another rioting-related crime, but police departments do not readily provide vandalism data.
Crimes Against Property by City and Week in Chicago, New York City, and Philadelphia
It is critical to make sure you have the best data to assess crime risk during this period and CAP Index is here to help.
Contact CAP Index to discuss how we can help your organization dive deeper into these numbers and analyze crime trends for specific categories.
Latest Posts
 Sample CRIMECAST Reports

Terms Of Use | Privacy Policy | Accessibility
© 2020-2024 CAP Index, Inc. All Rights Reserved.
Site Designed by R2 Creative Group