COVID-19 & Crime Issue #6: Crime Trends for Baltimore, Fort Worth, and Phoenix
The Analytics team at CAP Index continues to monitor how COVID-19 is impacting crime trends across the country. In this issue, we take a look at crime trends in three additional cities across the United States on a week-to-week basis and monthly basis with comparison to 2019 numbers.
Here we track weekly crime trends in major cities across the United States, starting with the first week in March (Week 1). It should be noted that COVID-19 restrictions started being implemented between Weeks 2 and 3. We currently are at Week 11 and we will continue to track crime trends into the future as businesses continue to reopen and police data become available.
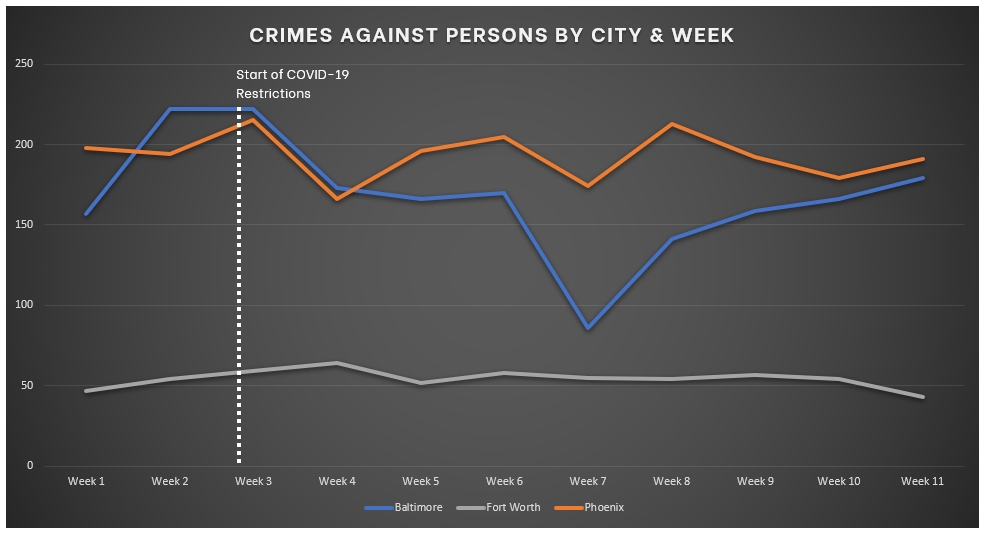
We saw a clear impact of COVID-19 restrictions on crime in most metropolitan areas examined in our previous issues. However, that is not the case for the current three cities. Baltimore is the only one with a decrease in Crimes Against Persons after the start of COVID-19 restrictions. However, the significant drop in Week 7 is somewhat suspicious.
The bottom table provides monthly crime count comparisons for 2019 versus 2020. They tend to show crime increases and decreases of differing degrees for the first four months of the year. Please note a consistent upward trend in Crimes Against Persons for Fort Worth. Again, please note that COVID-19 restrictions began to be implemented in the middle of March.
TRENDS FOR CRIMES AGAINST PERSONS
The following table and chart show the trends for Crimes Against Persons, which include Homicide, Rape, Robbery, and Aggravated Assault. Note that week #1 begins on March 1st.
Crimes Against Persons – Weekly Data

Crimes Against Persons – Monthly Data 2019 vs. 2020

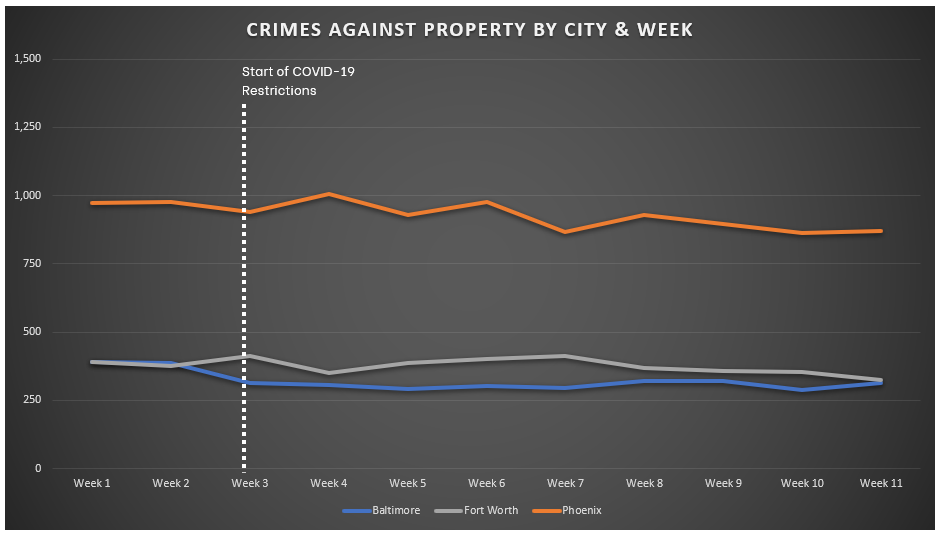
TRENDS FOR CRIMES AGAINST PROPERTY
The following table and chart present the number of Crimes Against Property, which include Burglary, Larceny, Motor Vehicle Theft, and Arson. Week #1 begins on March 1st for all cities.
Crimes Against Property – Weekly Data

Crimes Against Property – Monthly Data 2019 vs. 2020

It is critical to make sure you have the best data to assess crime risk during this period and CAP Index is here to help.
Contact CAP Index to discuss how we can help your organization dive deeper into these numbers and analyze crime trends for specific categories.
Sources:
Baltimore – https://data.baltimorecity.gov/Public-Safety/BPD-Part-1-Victim-Based-Crime-Data/wsfq-mvij/data
Fort Worth – https://data.fortworthtexas.gov/Public-Safety/Crime-Data/k6ic-7kp7/data
Phoenix – https://www.phoenixopendata.com/dataset/crime-data/resource/0ce3411a-2fc6-4302-a33f-167f68608a20
Latest Posts
 Sample CRIMECAST Reports

Terms Of Use | Privacy Policy | Accessibility
© 2020-2024 CAP Index, Inc. All Rights Reserved.
Site Designed by R2 Creative Group